Local Soil Reconstruction & Subsurface Intelligence
Celtic Sea Floating Offshore Wind – Local Soil Reconstruction & Subsurface Intelligence
Executive Summary
This study establishes the soil reconstruction layer of Morie Analytics by transforming sparse geotechnical information into engineering-ready soil profiles at anchor locations.
Starting from a layout generated in morie_layout, the workflow constructs a localized soil domain, generates a synthetic ground truth model, emulates tomographic sampling, and reconstructs vertical soil profiles from sparse sectional data.
The process is performed in a controlled environment where the true subsurface is known, enabling quantitative validation of reconstruction accuracy before application to real offshore datasets.
Site intelligence → Layout generation → Soil reconstruction → Mooring physics → Anchor verification → Cable optimization
Project Scope
- Local domain extraction from selected floater cluster
- Cropping of bathymetry and soil datasets
- Synthetic layered soil model generation
- Tomographic sampling using sectional planes
- Soil profile reconstruction via interpolation
- Boundary detection and validation
- Multi-anchor soil characterization
- Quantitative validation of reconstructed layer boundaries
- Multi-anchor statistical evaluation of reconstruction performance
This study converts layout intelligence into anchor-ready subsurface inputs.
Engineering Context
Following layout definition, the next geotechnical question is:
What soil profile is acting at each anchor location?
Anchor design depends critically on:
- Soil stratigraphy
- Layer boundaries
- Spatial variability
- Localized geotechnical interpretation
However, early-stage offshore projects typically rely on:
- Sparse CPT data
- Limited geotechnical sections
- Incomplete subsurface coverage
This workflow introduces a localized reconstruction methodology, where sparse sectional information is converted into soil profiles suitable for downstream engineering analysis.
To address this, the workflow is first applied in a controlled synthetic setting, where the true subsurface is known. This allows direct validation of reconstruction accuracy and provides confidence in the methodology before application to real geotechnical datasets.
Inputs and Data Sources
This study builds directly on upstream Morie Analytics outputs:
From morie_site
- Bathymetry and soil classification grids
- Lease boundary definitions
From morie_layout
- Selected floater cluster
- FOWT coordinates
- Shared-anchor typologies and coordinates
- Local layout footprint
Additional Inputs
- Layered soil profile definitions
- Cropped local-domain datasets
- Synthetic soil-model parameters
All inputs are aligned in a common projected coordinate system.
This provides the subsurface data framework for anchor-level characterization.
System Flow
Layout Geometry → Domain Extraction → Tomographic Sampling → Soil Reconstruction → Anchor Profiles
The architecture ensures traceability from spatial inputs to geotechnical outputs.
Processing Workflow
- Load selected layout and soil model
- Extract FOWT and anchor coordinates
- Define cropped local domain
- Generate synthetic soil model
- Build tomographic sampling grid
- Sample soil properties along planes
- Reconstruct profiles at anchor locations
- Detect layer boundaries
- Validate reconstruction against truth
- Select representative anchor location
This converts layout geometry into anchor-level soil profiles.
Local Domain Definition
The workflow begins by defining a localized engineering domain around the selected floater cluster.
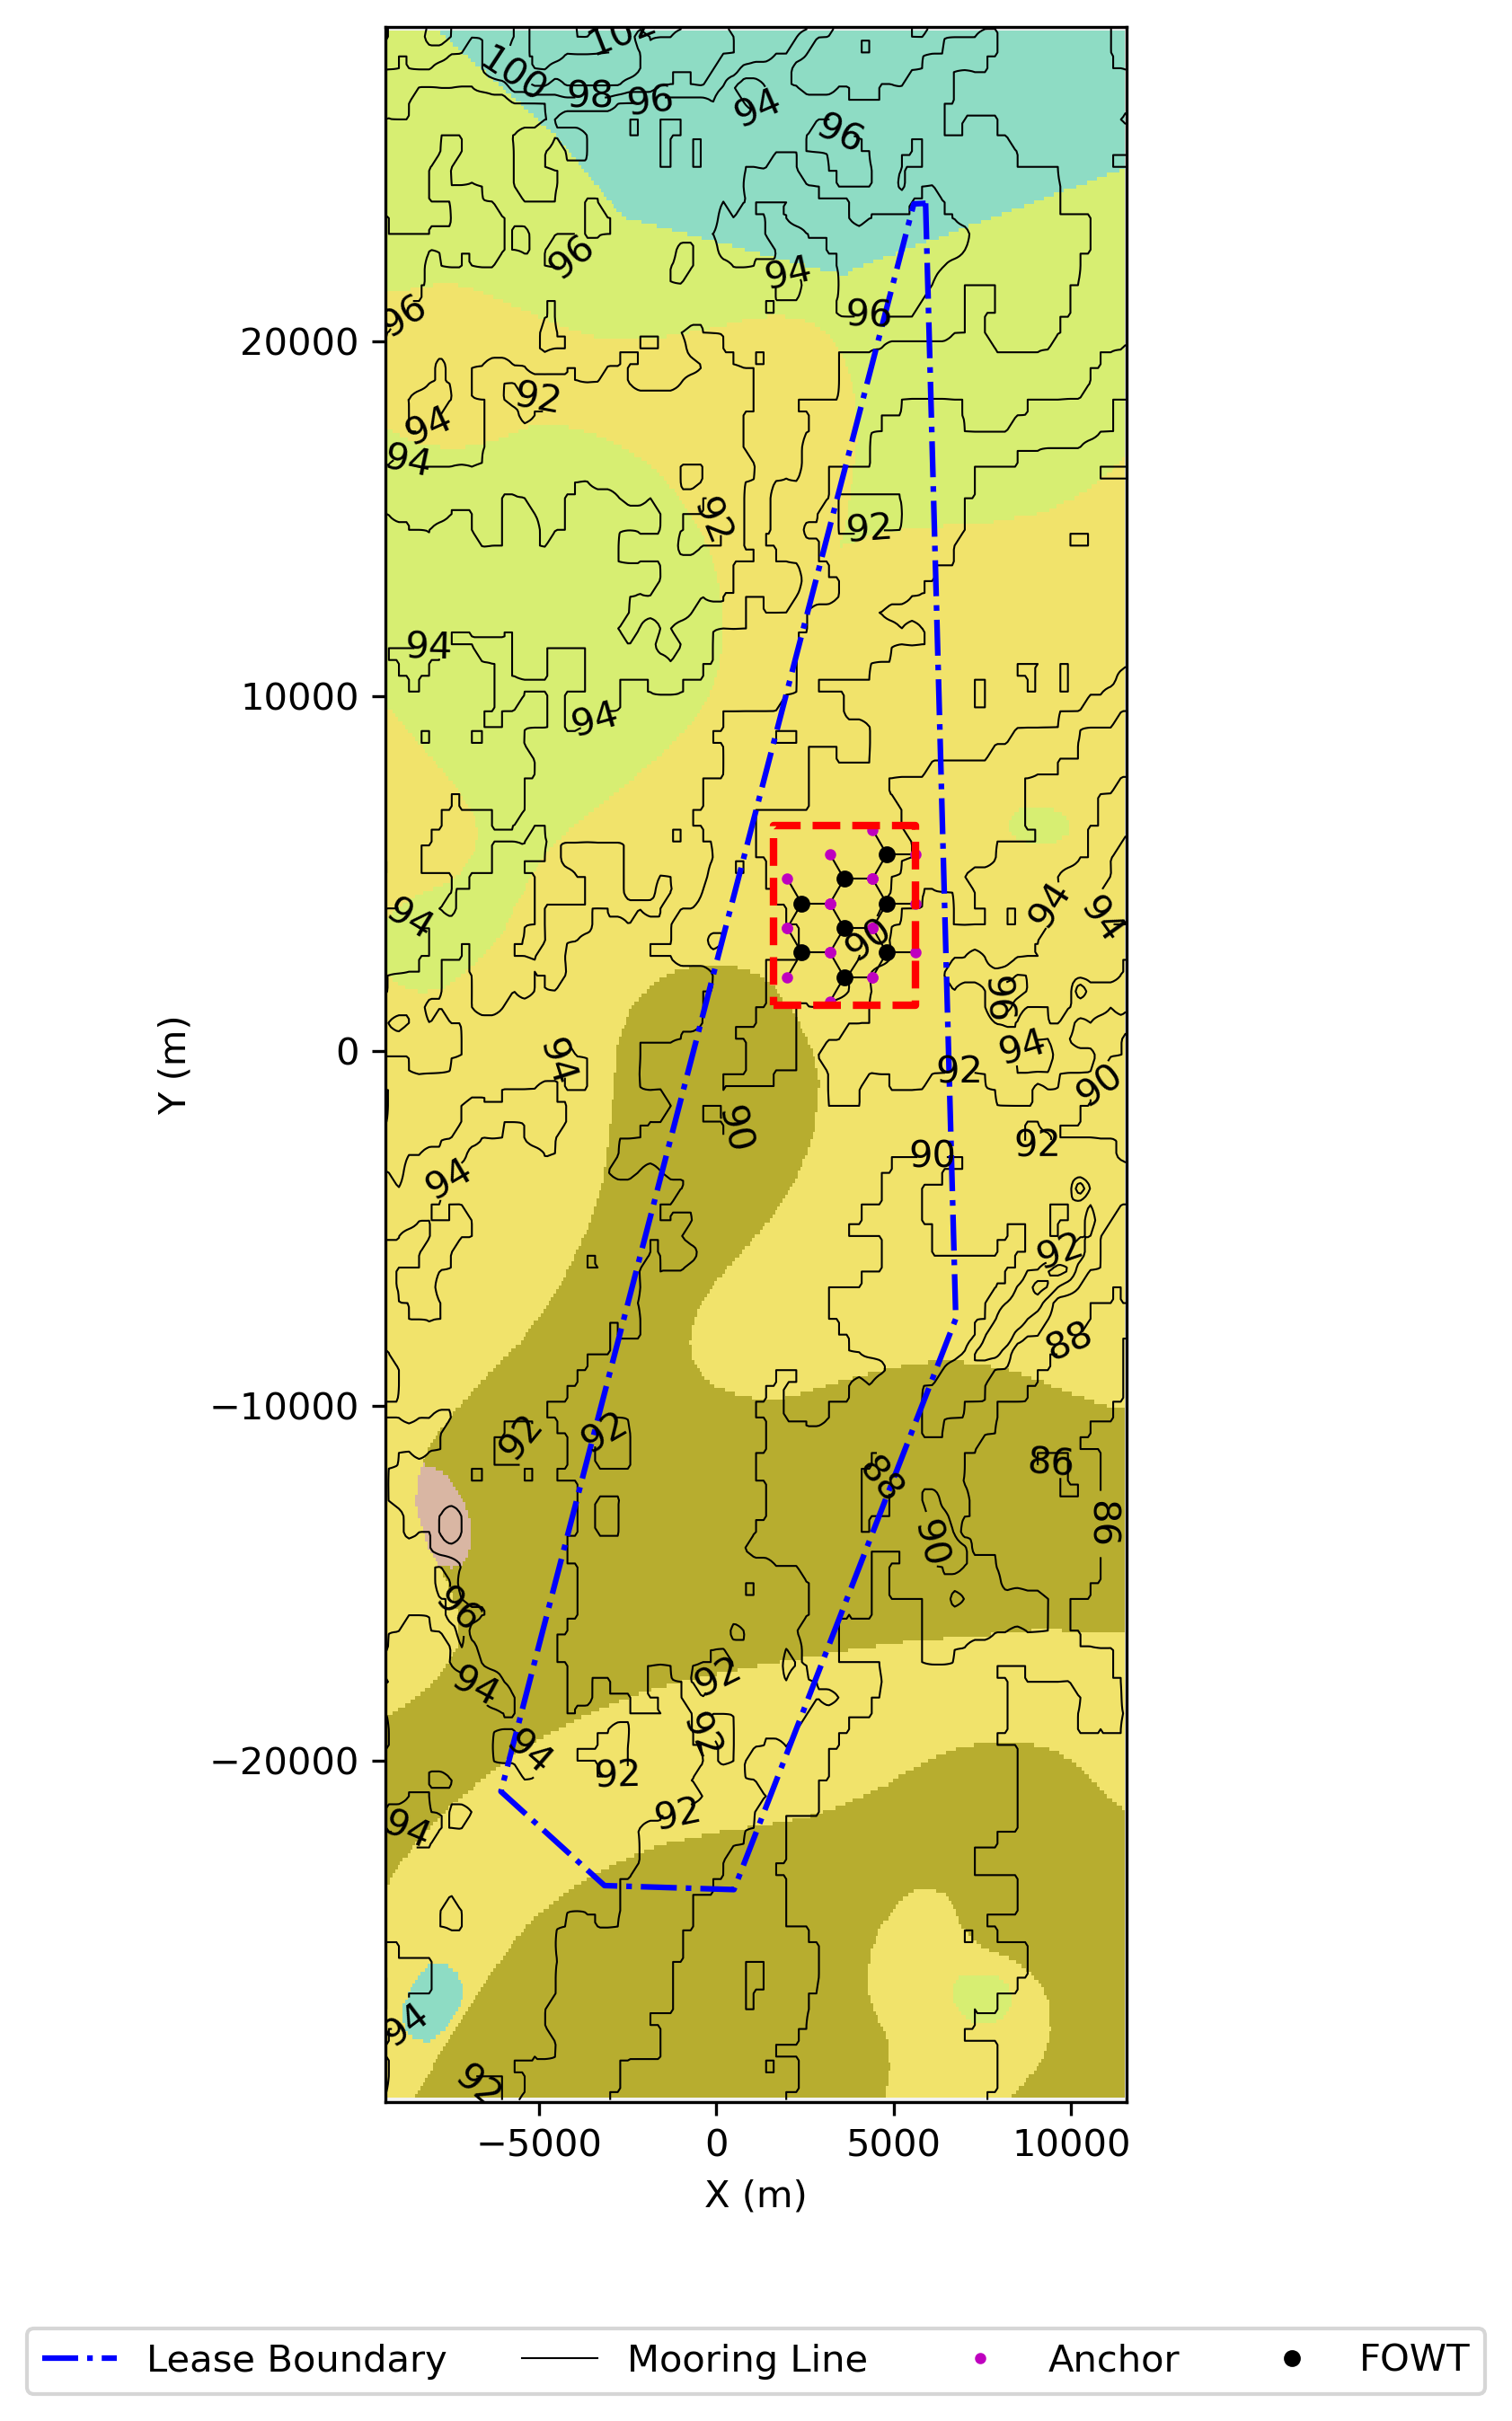
Figure 1 – Lease boundary and cropped local soil domain highlighting the selected floater cluster and associated anchor positions.
Engineering Significance
This figure establishes:
- The relationship between lease-scale site context and local soil study area
- The cropped analysis window used for detailed subsurface reconstruction
- Spatial continuity from
morie_siteandmorie_layoutinto geotechnical analysis
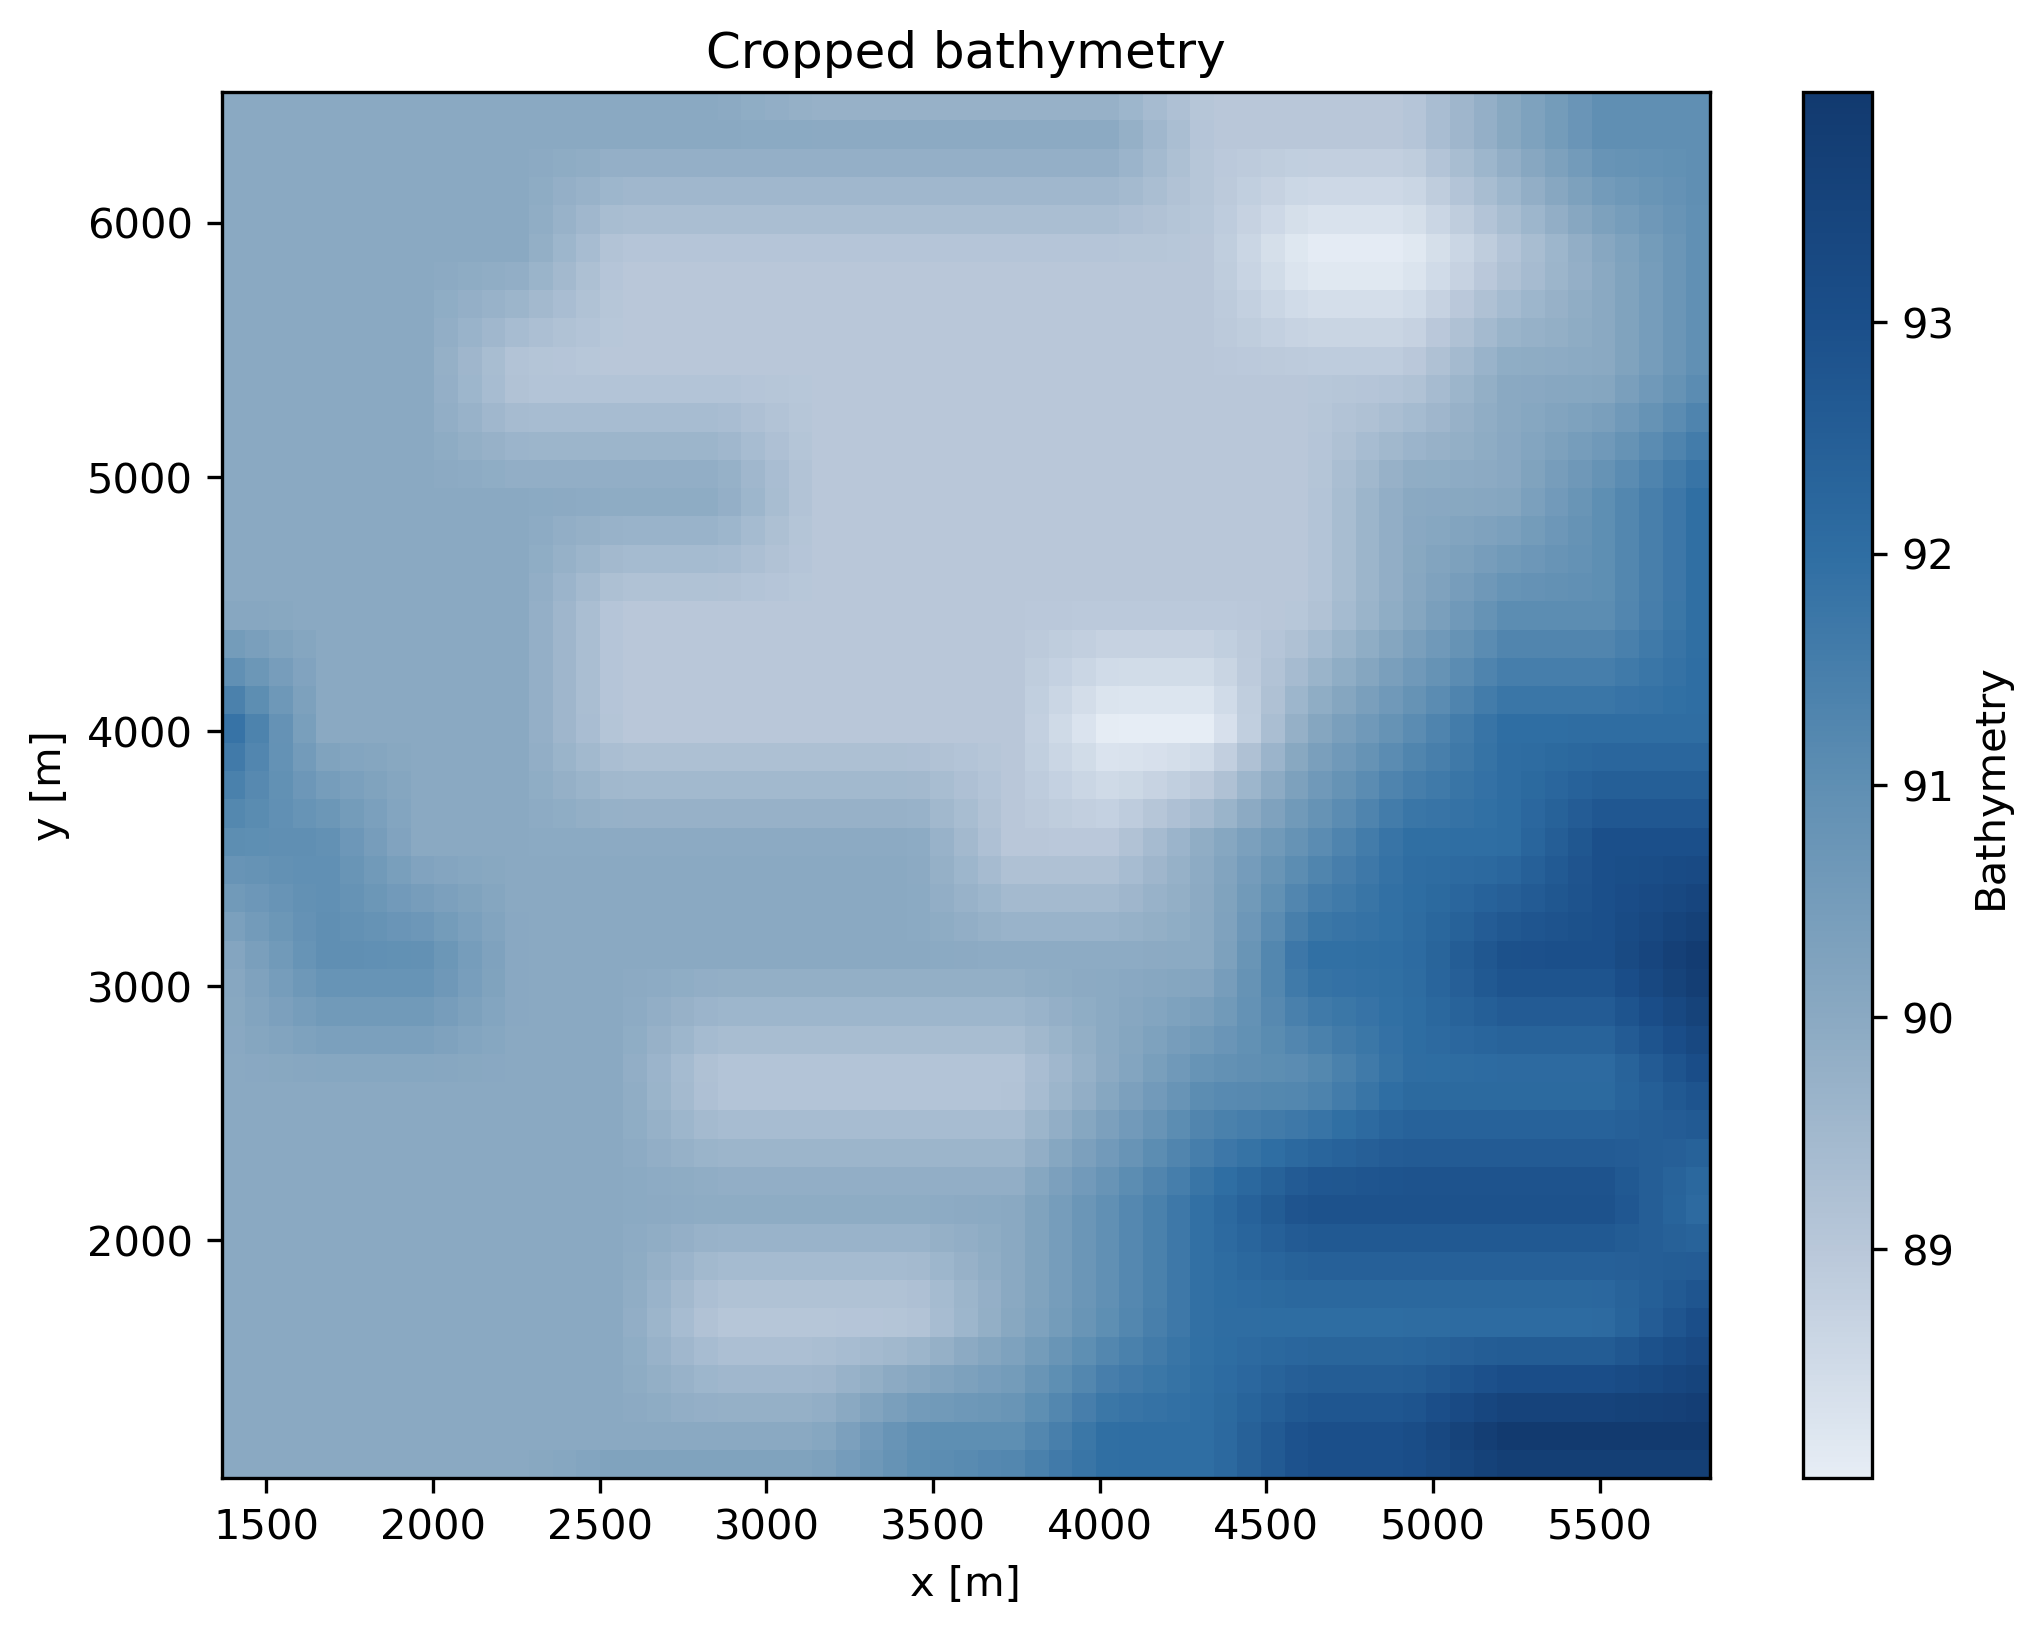
Figure 2 – Cropped bathymetry defining the local engineering domain.
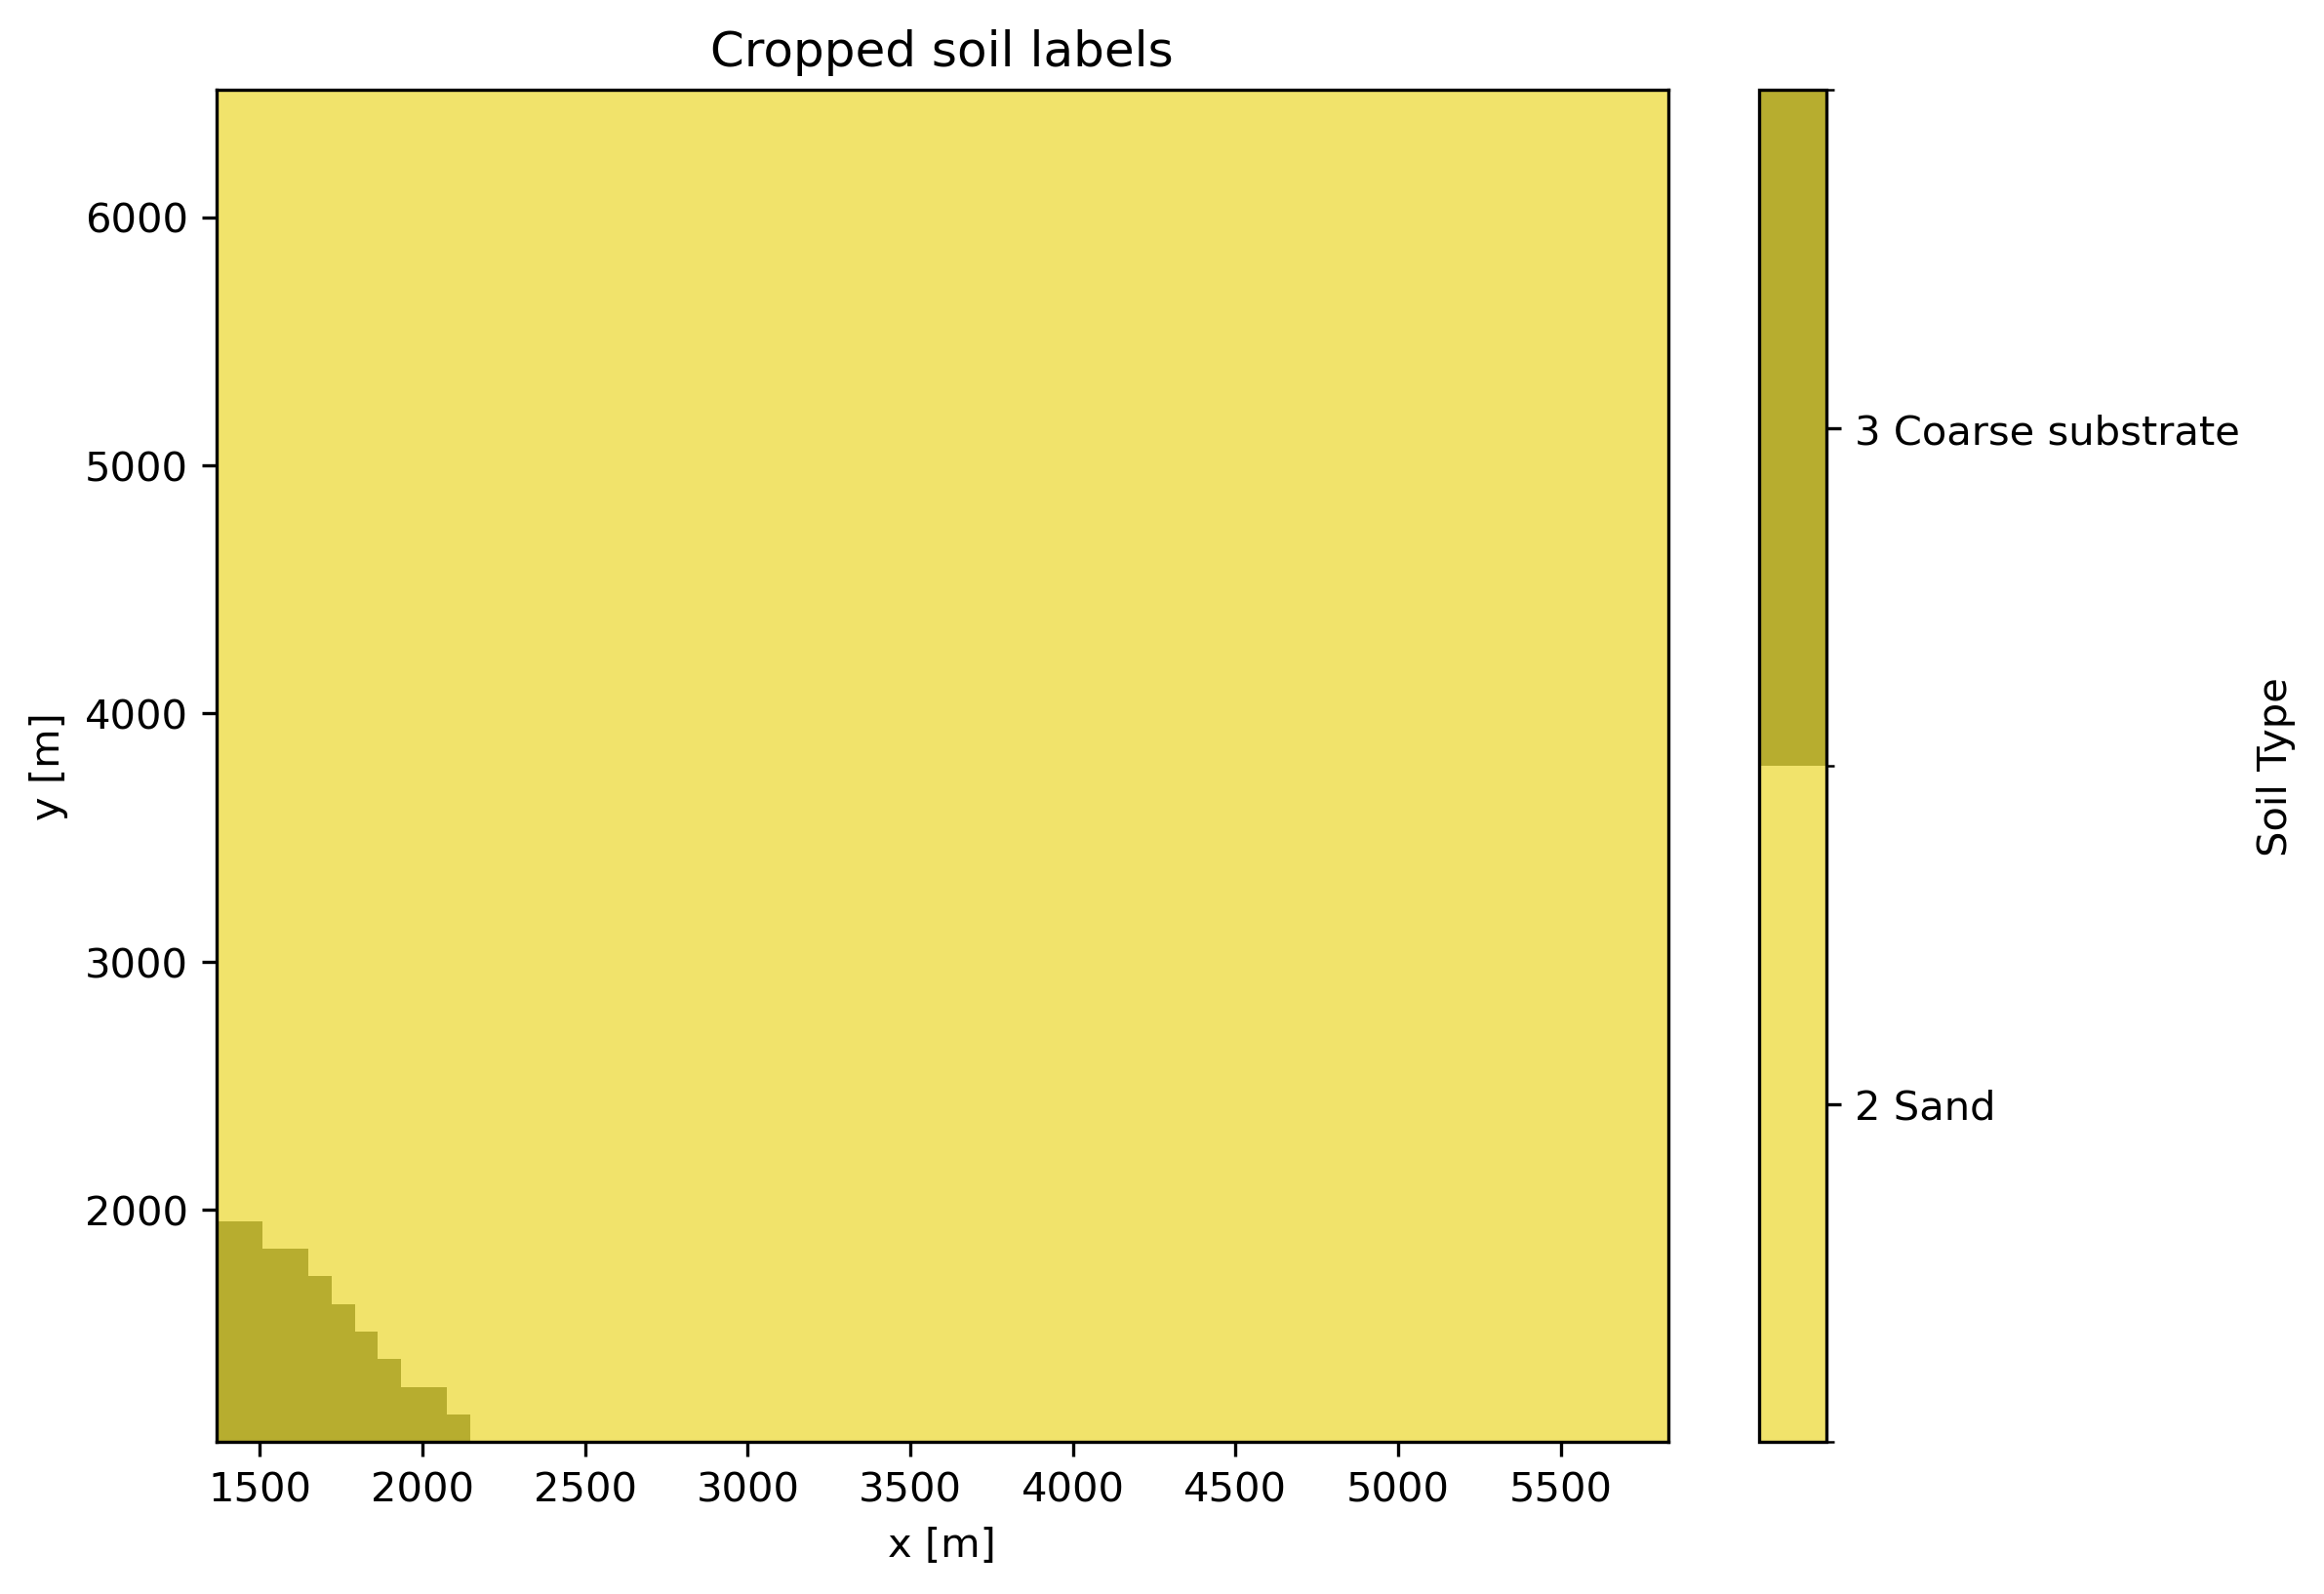
Figure 3 – Cropped soil classification aligned with the local layout domain.
Engineering Significance
These local-domain products define:
- A focused computational region around the layout
- Alignment between geometry and subsurface inputs
- The starting point for localized truth-model generation
Synthetic Soil Model (Ground Truth)
A synthetic truth model is generated over the cropped local domain to provide a controlled subsurface reference. The three layer model displays two boundary layers.
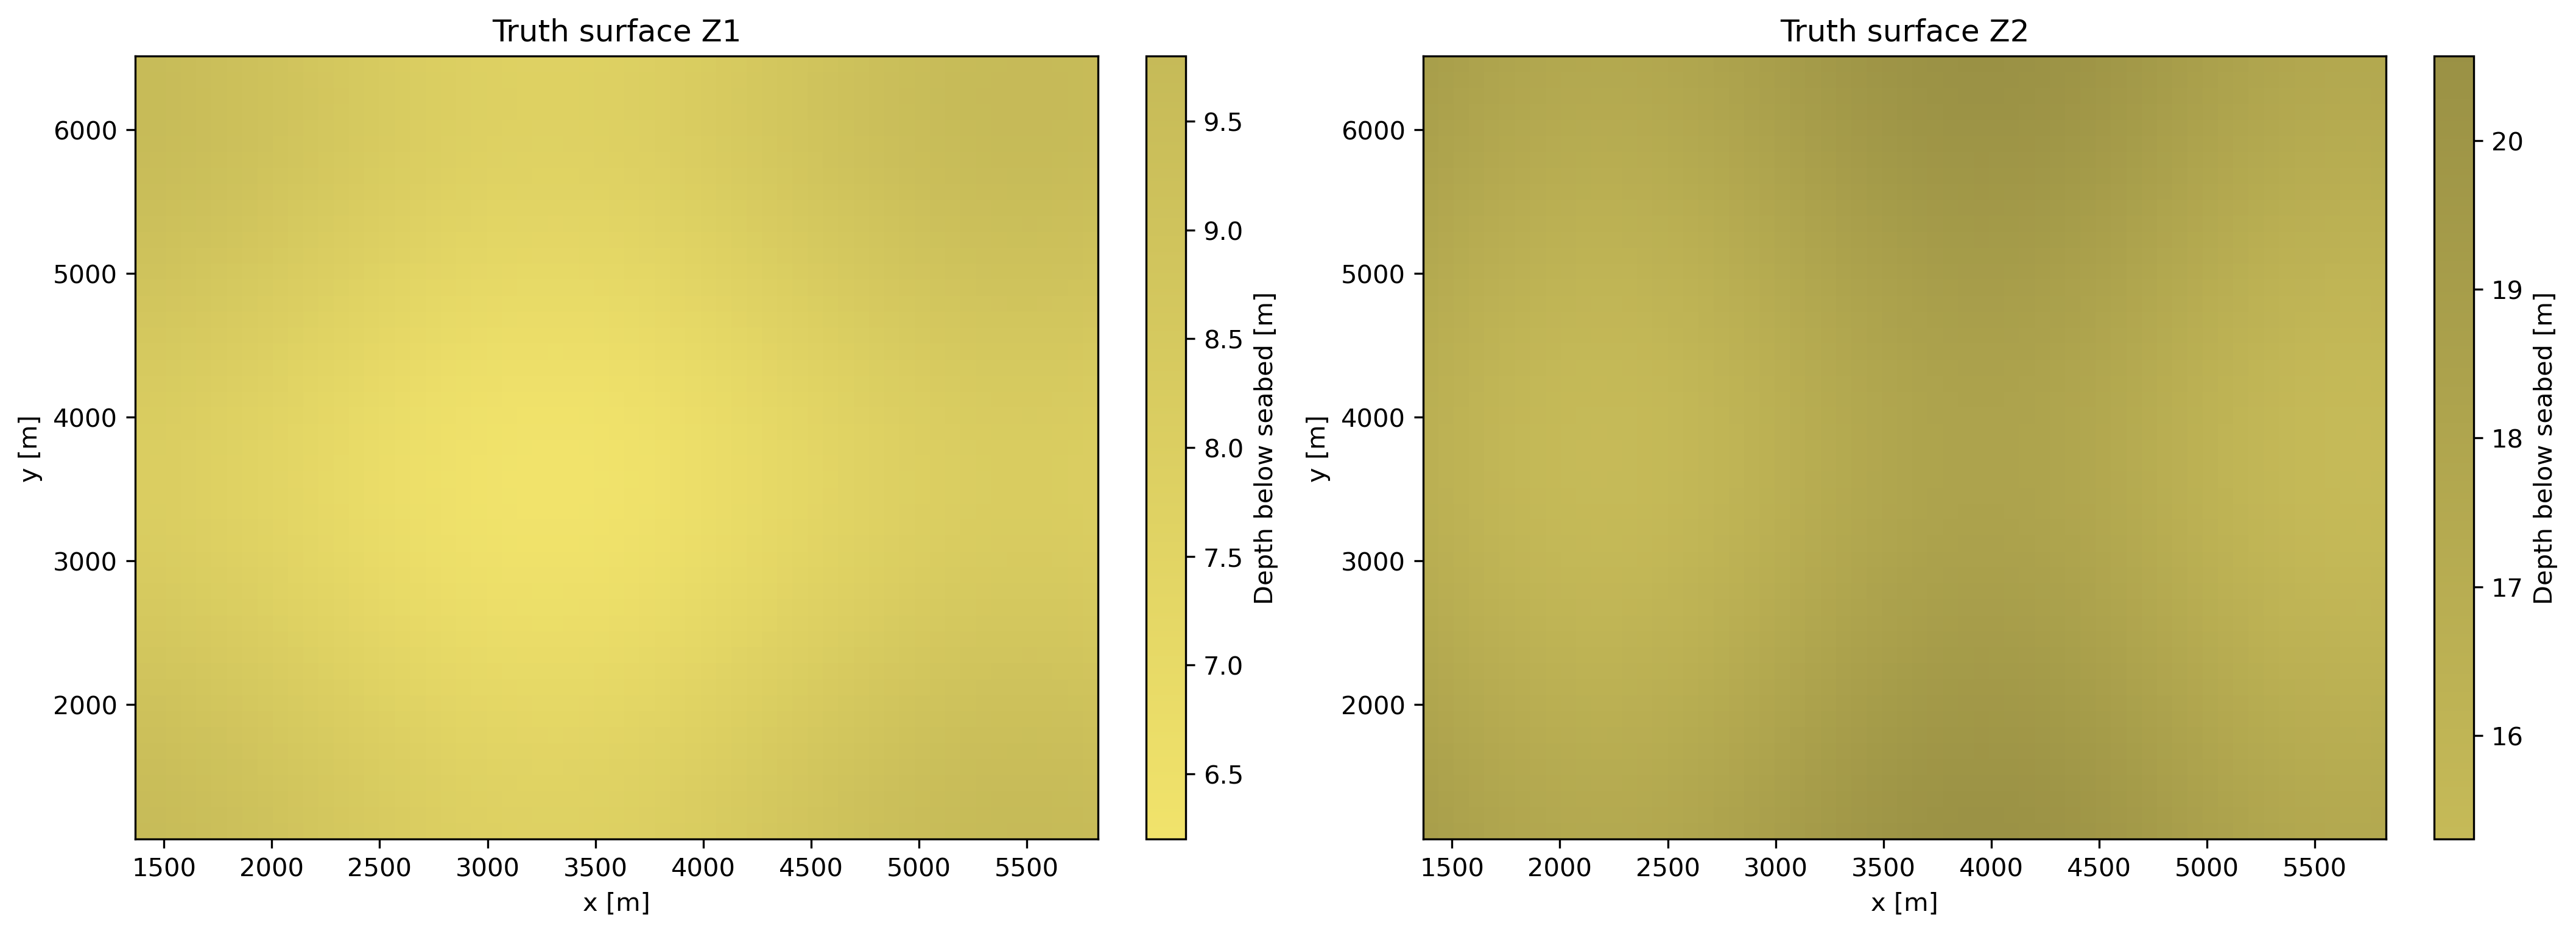
Figure 4 – Synthetic ground truth soil model with spatially varying layer interfaces.
Model Characteristics
- Three-layer sand system
- Interfaces: Z1 and Z2
- Spatially varying layer boundaries
- Linear variation of soil parameters within each layer:
- Friction angle, φ
- Relative density, Dr
- Unit weight, γ
Engineering Significance
The truth model provides:
- A controlled reference model
- Known boundaries for validation
- A benchmark to quantify reconstruction performance
Tomographic Sampling Framework
To emulate realistic geotechnical data availability, the workflow defines a sparse tomographic sampling framework using 4 planes per main direction.
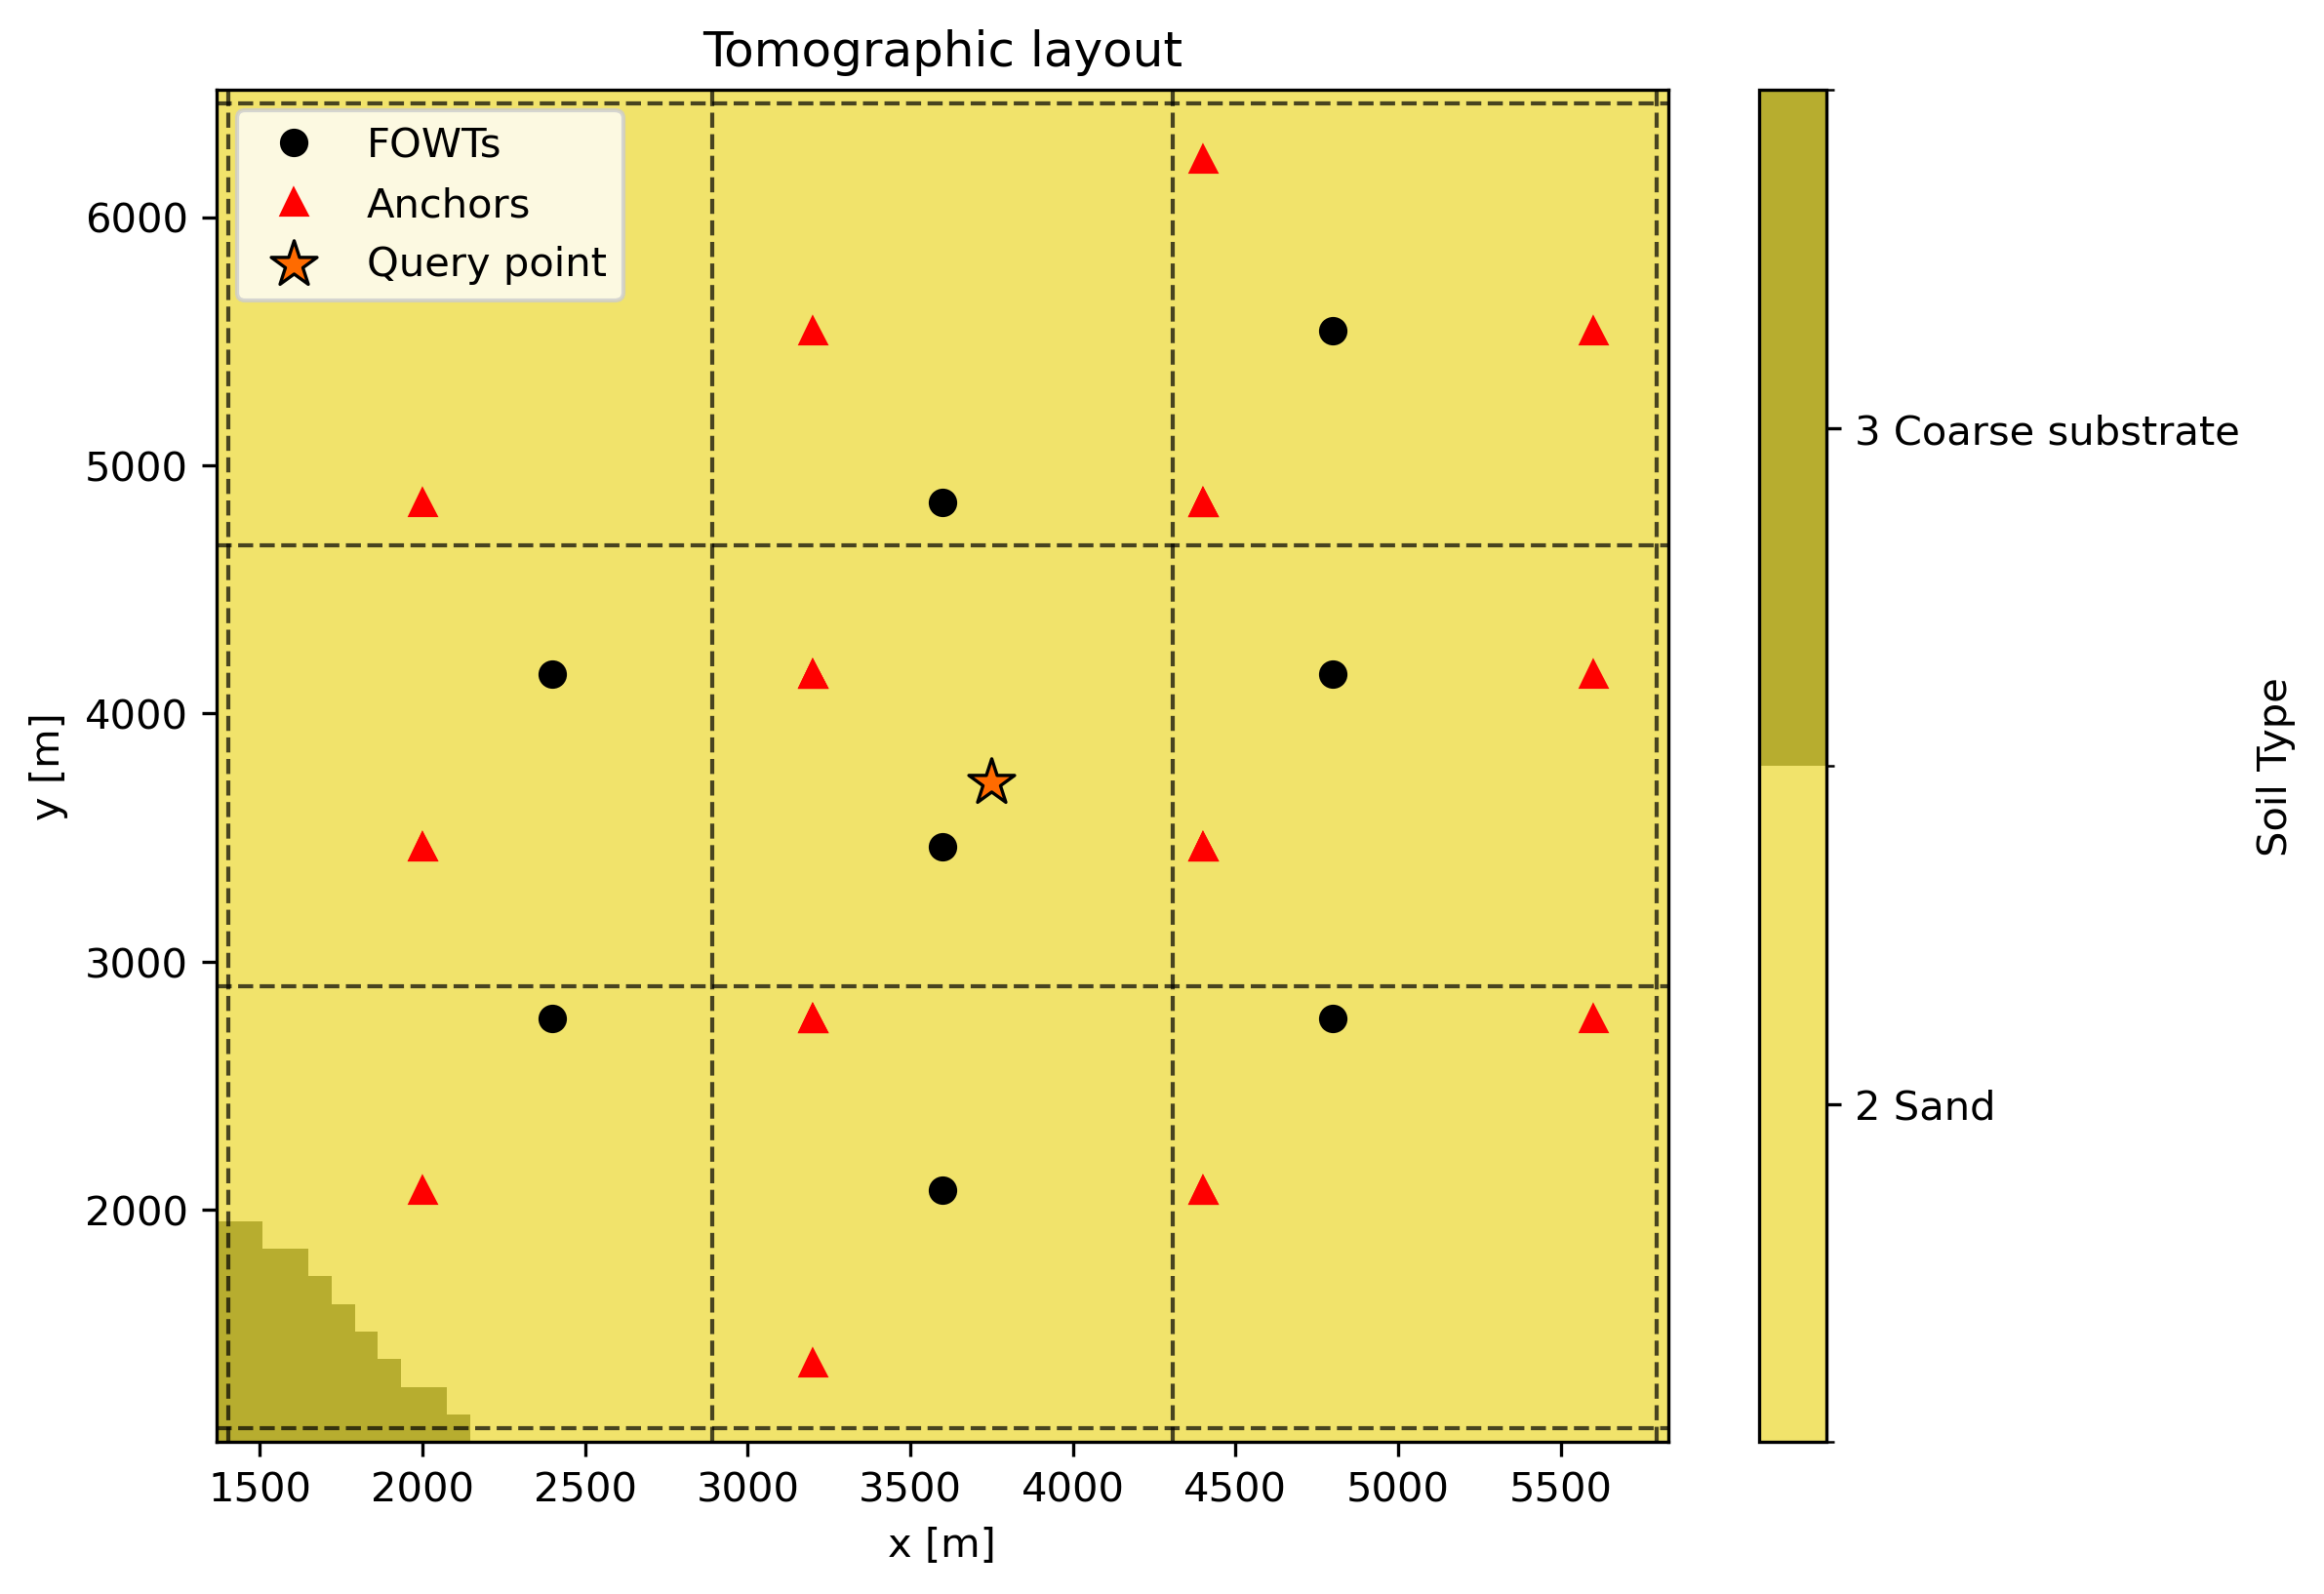
Figure 5 – Tomographic acquisition grid representing sparse geotechnical sampling across the local domain.
Configuration
- 4 XZ planes
- 4 YZ planes
- Single-point validation location inside the cluster
- Full anchor set preserved for later reconstruction
Engineering Significance
This step represents:
- CPT-style investigation lines
- Sectional surveys
- Limited geotechnical campaigns under realistic coverage constraints
Unlike isolated borehole or CPT-based approaches, this configuration captures spatial continuity through sectional sampling, enabling reconstruction between investigation lines.
Soil Section Sampling
The synthetic truth model is sampled along each tomographic plane to generate the available sectional dataset.
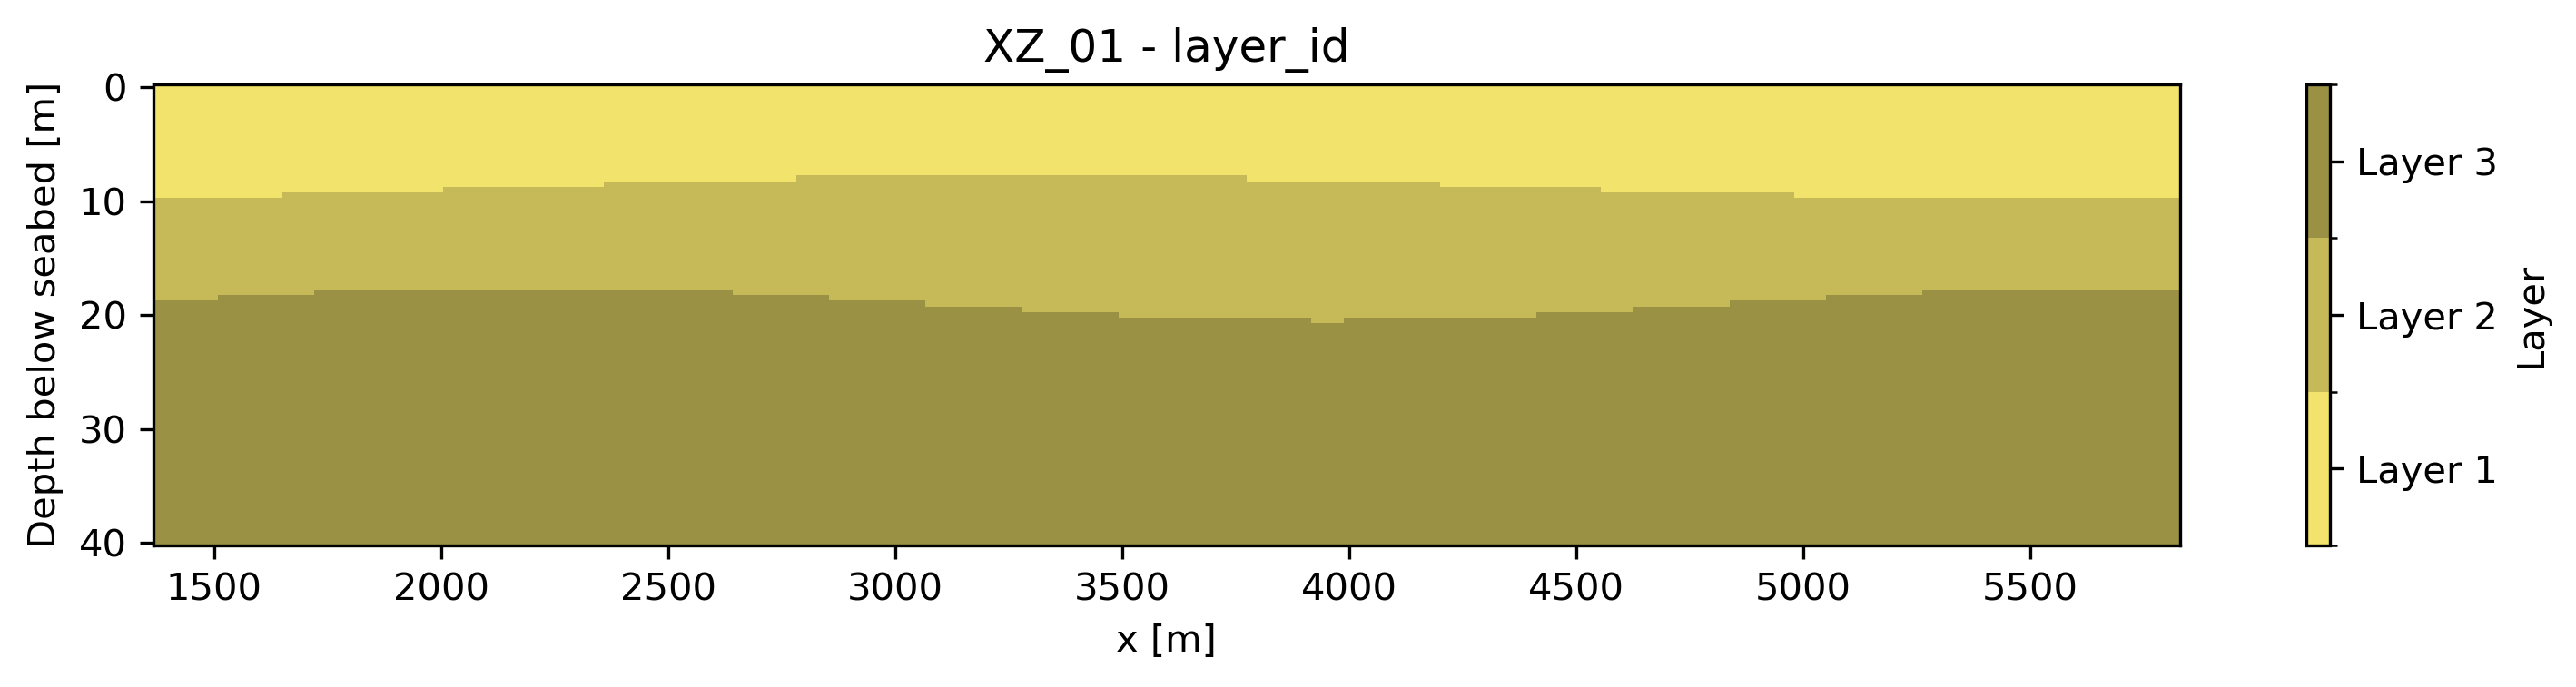
Figure 6 – Example XZ section showing vertical layering and lateral variability.
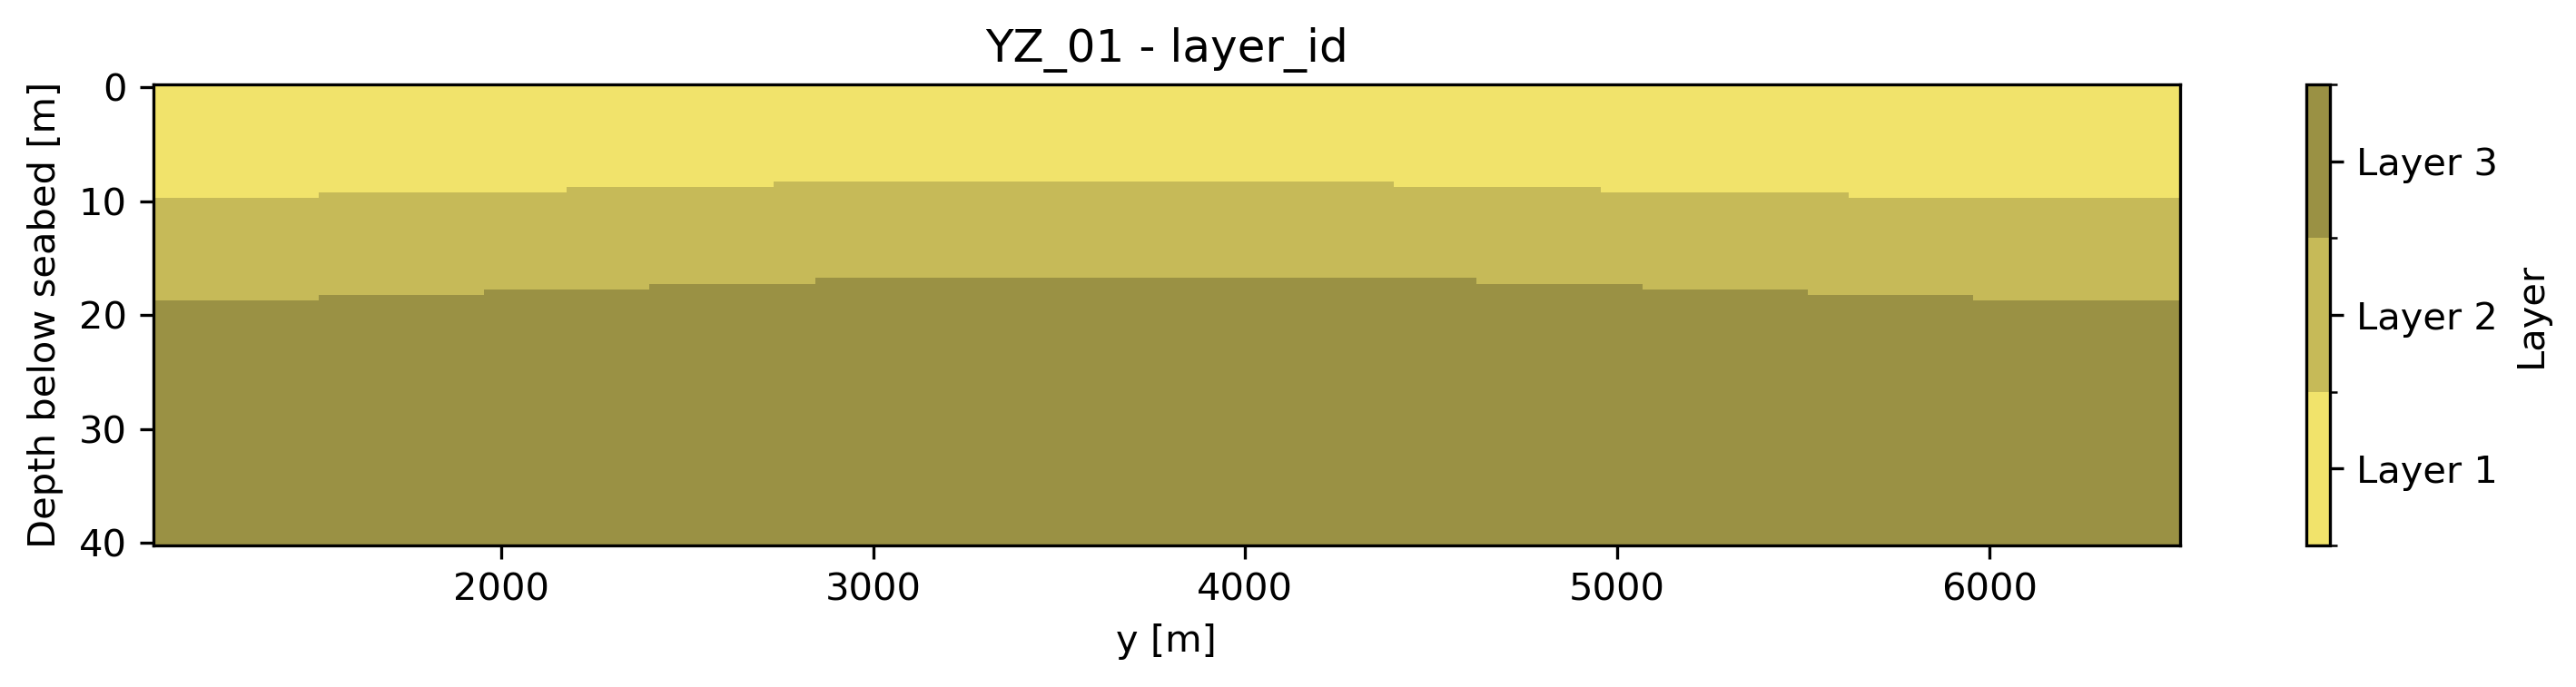
Figure 7 – Example YZ section showing vertical layering and lateral variability.
Engineering Significance
These sections form the available dataset, capturing:
- Vertical layer stacking
- Lateral variation across the domain
- Sparse but structured information for downstream interpolation
Profile Reconstruction
A single-point controlled validation case is first used to assess the reconstruction methodology within the selected layout.
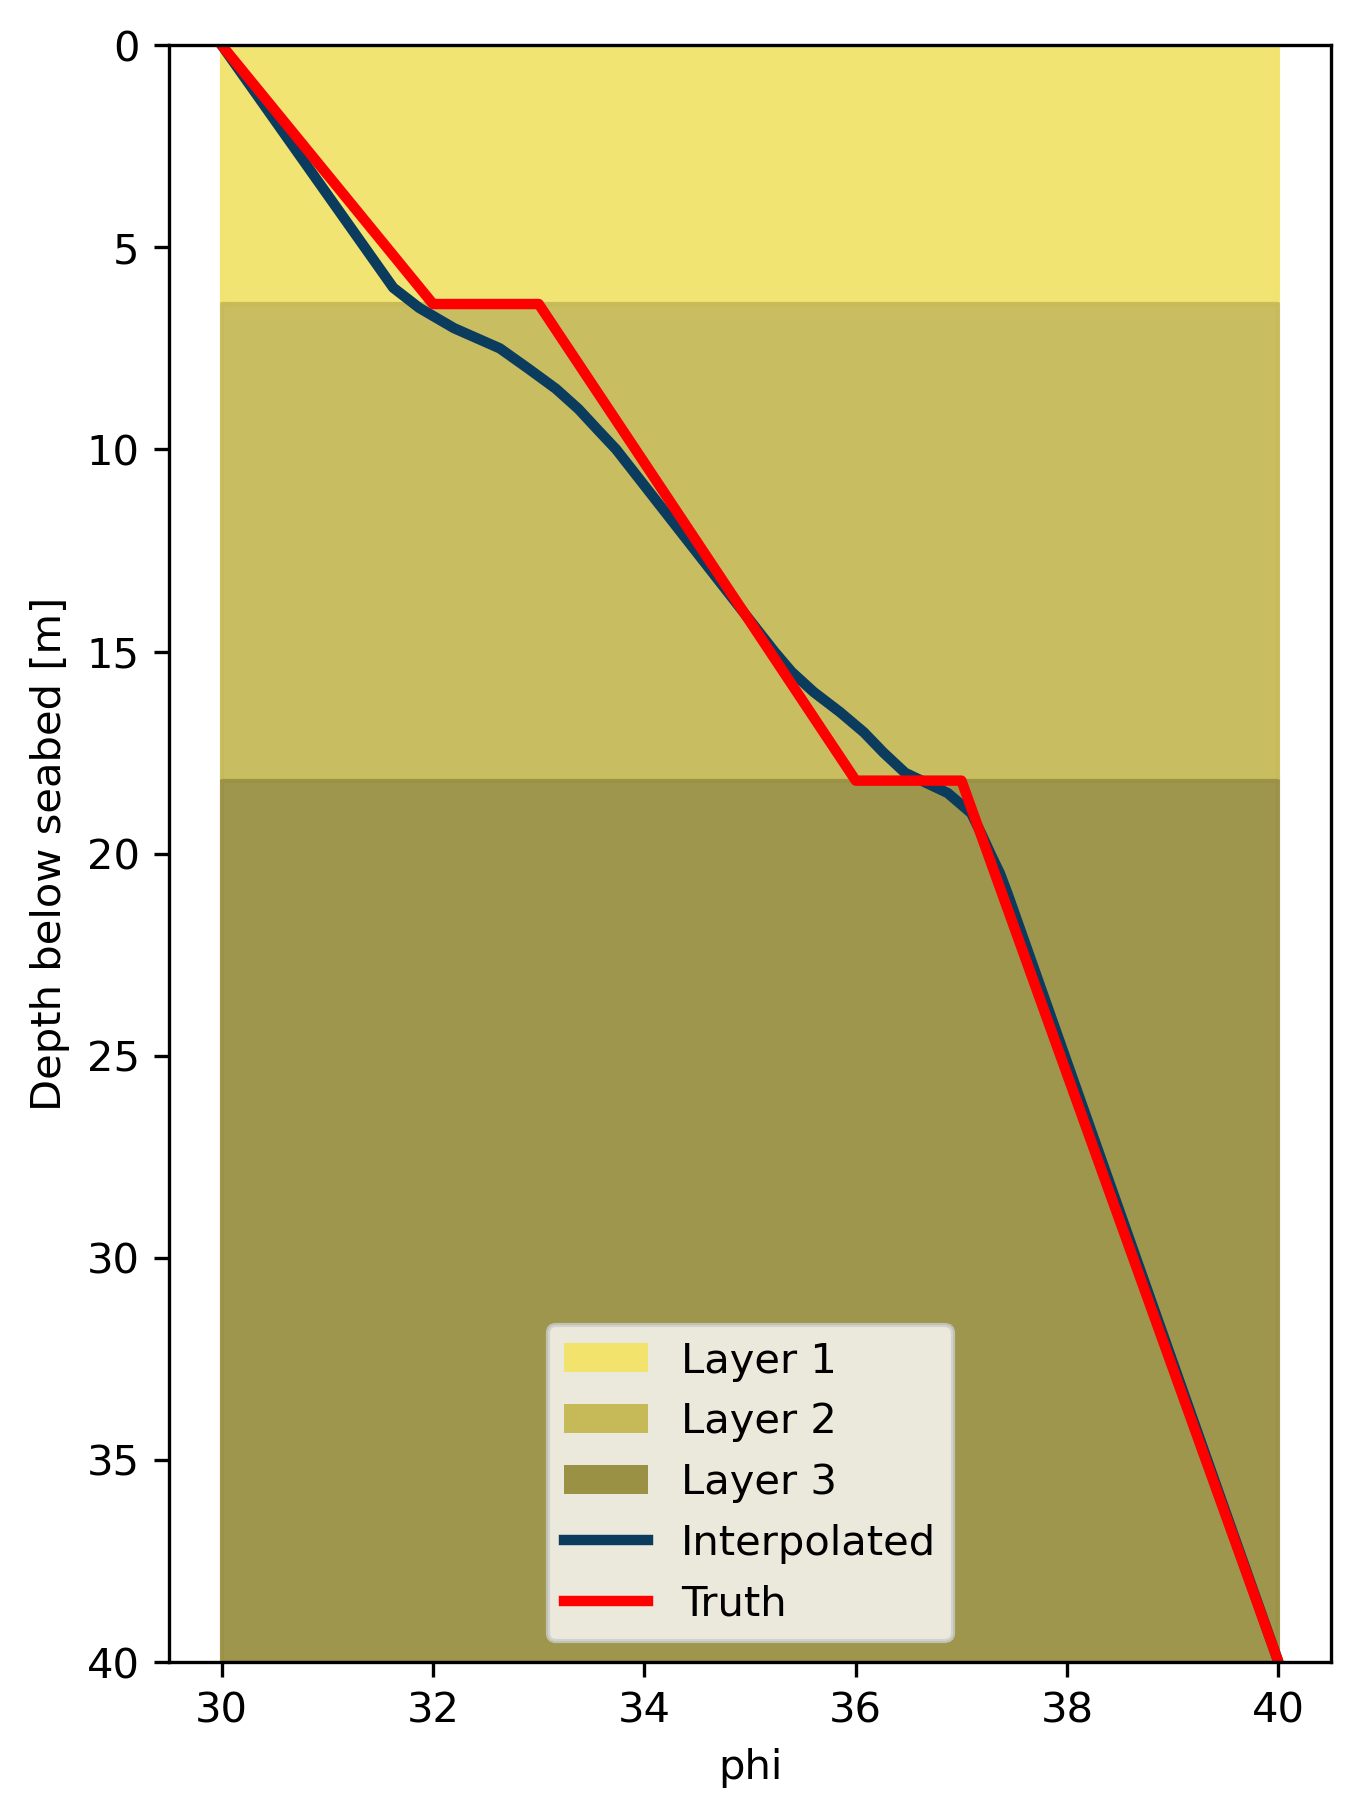
Figure 8 – Reconstructed vs ground truth soil profile at the single-point validation location.
Method
- Inverse Distance Weighting (IDW)
- Multi-plane interpolation from XZ and YZ sections
Engineering Output
- Linear variability of soil properties with depth - φ(z), Dr(z), γ(z)
- Local profile reconstruction from sparse sections
- Validation of the proof-of-concept interpolation approach
Boundary Detection & Validation
The reconstructed profile is then converted into discrete engineering layers through boundary detection.
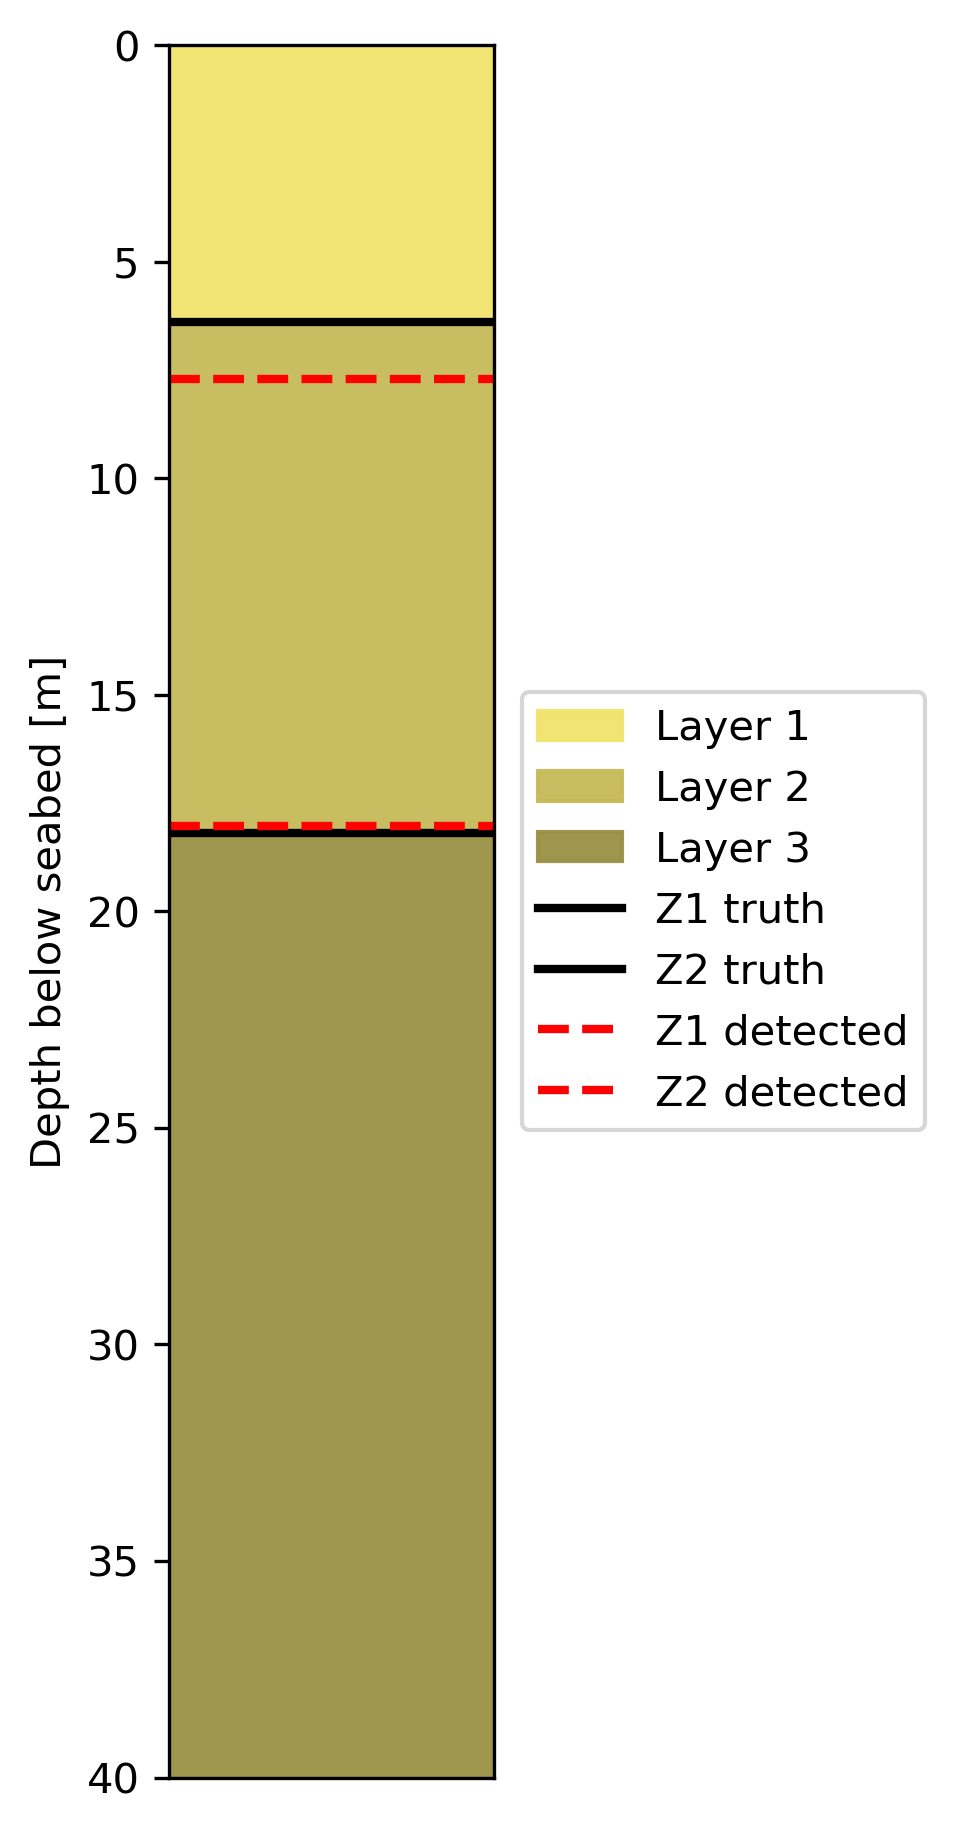
Figure 9 – Boundary detection accuracy at the single-point validation location.
Within the synthetic validation domain, boundary detection errors at the validation point are on the order of decimetres. Across all anchors, mean absolute errors are approximately 0.2 m for both Z1 and Z2, with maximum deviations remaining below ~1 m. These metrics quantify reconstruction performance against the controlled truth model, not uncertainty against real geological variability.
Engineering Significance
This step transforms reconstructed profiles into:
- Discrete engineering layers
- Inputs for capacity models
- Quantified reconstruction accuracy
Multi-Anchor Evaluation
Following proof-of-concept validation, the workflow is applied across all anchors in the selected layout.
- 24 anchors evaluated
- Independent reconstruction at each anchor location
- Boundary comparison metrics computed for all anchors
- Ranking performed based on total boundary error
Selected Anchor
- fowt1b → selected as downstream handoff anchor for
morie_anchor, ensuring traceability from soil reconstruction to anchor design
This selection is now formalized in the workflow and exported for the downstream case study. The structure represents the final engineering output of the soil reconstruction workflow.
Engineering Significance
This step ensures that the soil-reconstruction module produces actionable anchor-specific outputs, not only validation figures.
Outputs Generated
The workflow produces:
- Lease-to-local crop context figure
- Cropped bathymetry and soil grids
- Synthetic truth soil model
- Tomographic section plots
- Single-point profile validation plots
- Boundary detection results
- Anchor-level soil datasets
- Selected downstream anchor definition
- Engineering-ready soil profiles at anchor locations
These outputs are directly usable in the next engineering modules.
Engineering Applications
The outputs support:
- Anchor design input generation
- Soil-structure interaction modeling
- Early-stage geotechnical interpretation
- Validation of sparse-data reconstruction
- Integration with anchor capacity workflows
- Validation of geotechnical assumptions under sparse data conditions
This transforms sparse subsurface information into structured engineering inputs for early-stage assessment.
Within the controlled synthetic domain used in this study, the results demonstrate that tomographic reconstruction can recover layer boundaries with sufficient accuracy to support proof-of-concept anchor-level screening. Application to real offshore datasets requires calibration against CPT, borehole or geophysical investigation data.
Relationship to Other Morie Study Cases
This study is the subsurface intelligence bridge of the Morie Analytics workflow.
Receives from:
- morie_site → lease boundary, bathymetry and soil grids
- morie_layout → floater cluster and anchor coordinates
Feeds into:
- morie_anchor → selected anchor profile and boundary definition
- morie_mooring → soil-informed assumptions for mooring line seabed contact
It provides the geotechnical transition from layout geometry to anchor design.
Why It Matters Commercially
- Reduces uncertainty in early-stage geotechnical interpretation
- Enables engineering decisions with limited site data
- Improves reliability of anchor sizing inputs
- Supports scalable offshore development workflows
- Bridges the gap between GIS-scale data and anchor-scale design
- Enables anchor design decisions before full site investigation campaigns are available
This is where subsurface uncertainty begins to be structured, tested and reduced.
Aspects to Improve
- Integration with real CPT datasets
- Multi-soil systems (clay, sand, rock)
- Uncertainty quantification
- Adaptive sampling strategies
- Machine learning-based reconstruction
These extensions would move the workflow closer to project-grade geotechnical intelligence.
Design Philosophy
This study reflects the Morie Analytics approach:
- Physics-informed
- Modular
- Traceable
- Engineering-focused
- Scalable