Generation & Spatial Topology Screening
Celtic Sea Floating Offshore Wind – Layout Generation & Spatial Topology Screening
Executive Summary
This study establishes the layout generation layer of Morie Analytics by transforming standardized environmental engineering resources into engineering-ready floating offshore wind system configurations.
Building upon the bathymetry, seabed characterization and environmental resources generated by morie_site, together with representative wind resource and turbine definitions,
the workflow identifies feasible development regions, evaluates representative engineering templates, and deploys a selected configuration within a constrained hexagonal lattice
through a topology-driven engineering methodology.
Rather than treating layout generation as a purely geometric or aerodynamic problem, the workflow first evaluates engineering configurations compatible with shared-anchor system architectures before deploying the selected template within the feasible engineering domain. Candidate configurations are subsequently assessed using additional engineering criteria, including wake effects and annual energy production (AEP) through PyWake, while preserving the underlying topology-driven design philosophy.
The selected engineering configuration is then propagated directly into the project ontology, automatically generating the corresponding mooring system and shared-anchor network for downstream multidisciplinary engineering analyses.
The result is a deterministic, reproducible and modular engineering workflow that transforms standardized environmental engineering resources into engineering-ready offshore wind system configurations. The reference case corresponds to a 120 MW floating wind cluster, demonstrating how early-stage environmental characterization can be translated into an integrated offshore engineering system ready for downstream physics-based workflows.
Site intelligence → Layout generation → Soil reconstruction → Mooring physics → Anchor verification → Cable optimization
Project Scope
- Site-driven engineering template deployment based on standardized environmental engineering resources
- Bathymetry- and soil-constrained feasibility filtering
- Constrained hexagonal lattice generation
- Engineering template selection through topology-driven assessment
- Site-constrained engineering template deployment
- Wake effects and annual energy production (AEP) assessment using PyWake
- Project ontology generation for downstream workflows
- Automatic mooring system and shared-anchor network generation
This study converts site intelligence into structured spatial system design decisions, establishing a deterministic engineering workflow that bridges environmental characterization with physics-based floating offshore wind models.
The reference configuration consists of:
- 8 floating wind turbine generators (WTGs)
- 15 MW nominal capacity per unit
- Total installed capacity: 120 MW
This defines a cluster-scale floating wind system, used to evaluate engineering template deployment, topology-driven layout generation, wake performance and downstream mooring and anchor workflows.
Engineering Context
Following site characterization, the next critical step in floating offshore wind design is:
How should the wind farm be spatially configured?
At this stage, engineers must balance:
- Lease boundaries and setbacks
- Water depth constraints
- Wake effects and overall wind turbine performance
- Seabed conditions
- Mooring footprint interactions
- Shared-anchor potential
Traditional approaches often rely on manual placement or coarse geometric grids. While suitable for preliminary layout development, these approaches provide limited traceability and fail to capture the strong coupling between layout, mooring systems and anchor design.
This workflow introduces an engineering template-based methodology, where representative floating wind configurations are first evaluated using engineering criteria before being deployed within the feasible site.
The selected engineering template is subsequently positioned through a constrained hexagonal lattice, preserving a transparent and reproducible deployment strategy while maintaining compatibility with downstream mooring, anchor and cable analyses.
Wake effects and annual energy production are assessed through PyWake as part of the engineering evaluation, providing an additional performance metric without altering the underlying topology-driven design philosophy.
Detailed aerodynamic optimization would require site-specific wind resource characterization together with dedicated multi-objective optimization workflows and therefore remains beyond the scope of the present study.
Inputs and Data Sources
This study builds directly upon the standardized environmental engineering resources generated by upstream Morie Analytics workflows.
From morie_site
- Bathymetry
- Seabed classification
- Layered engineering soil profiles
- Lease boundary geometry
- Wind resource characterization
Additional Inputs
- Wind turbine definition
- Engineering template definitions
- Layout parameters (spacing, buffer and orientation)
All engineering resources are standardized within a common projected coordinate system and referenced through a consistent project ontology.
Together, these resources provide the environmental and engineering constraints required for topology-driven layout generation, ensuring full compatibility with downstream wake assessment, mooring system generation and shared-anchor analyses.
System Flow
Site Intelligence → Feasibility Assessment → Engineering Template Selection → Topology-Constrained Deployment → Engineering Assessment → System Configuration
The workflow transforms standardized environmental engineering resources into engineering-ready floating offshore wind system configurations, ensuring direct continuity with downstream physics-based Morie modules.
Processing Workflow
- Load standardized engineering resources from
morie_site - Build the engineering feasibility domain using bathymetry and seabed constraints
- Generate a constrained hexagonal lattice within the buffered lease area
- Identify feasible floater deployment locations
- Evaluate representative engineering templates
- Deploy candidate templates across the feasible lattice
- Assess topology, wake performance and engineering compatibility
- Select the reference engineering configuration
- Generate the project ontology and engineering model
- Automatically instantiate mooring systems, shared-anchor topology and downstream engineering resources
This workflow converts environmental intelligence into structured floating offshore wind system configurations, providing a deterministic foundation for downstream soil, mooring, anchor and cable engineering analyses.
Bathymetry & Soil Context
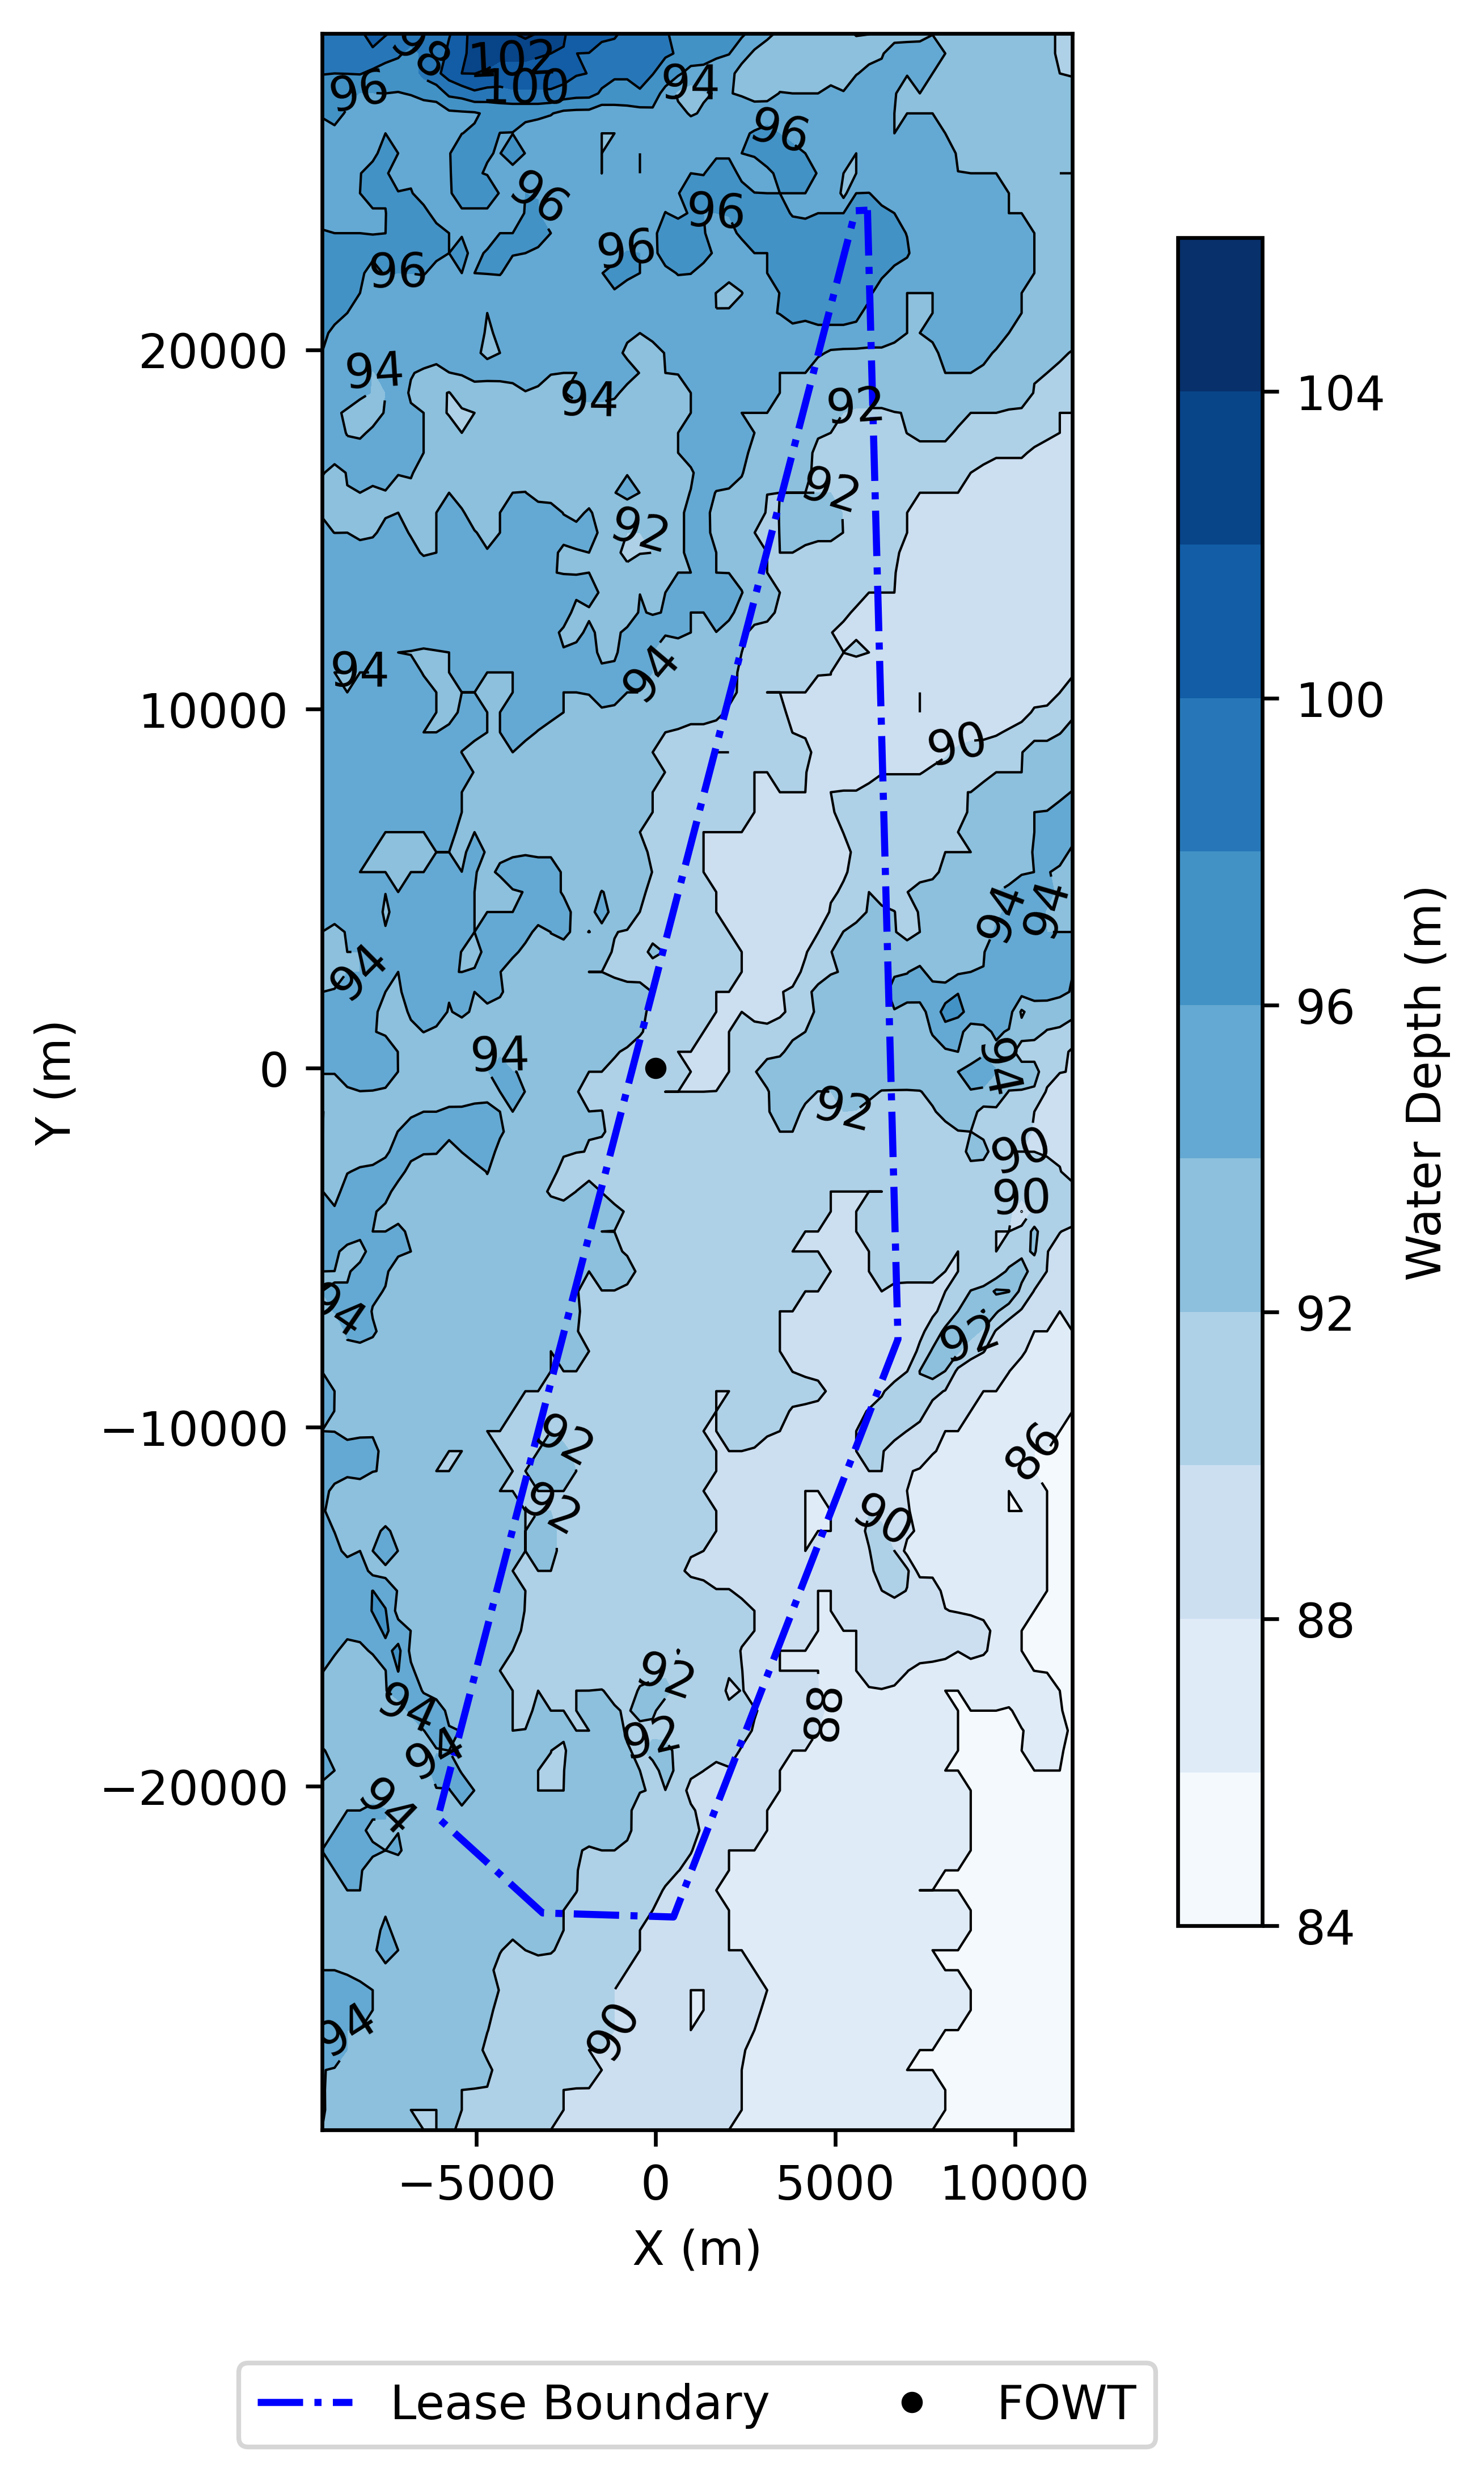
Figure 1 – Standardized bathymetry resource defining the primary depth constraints for engineering template deployment.
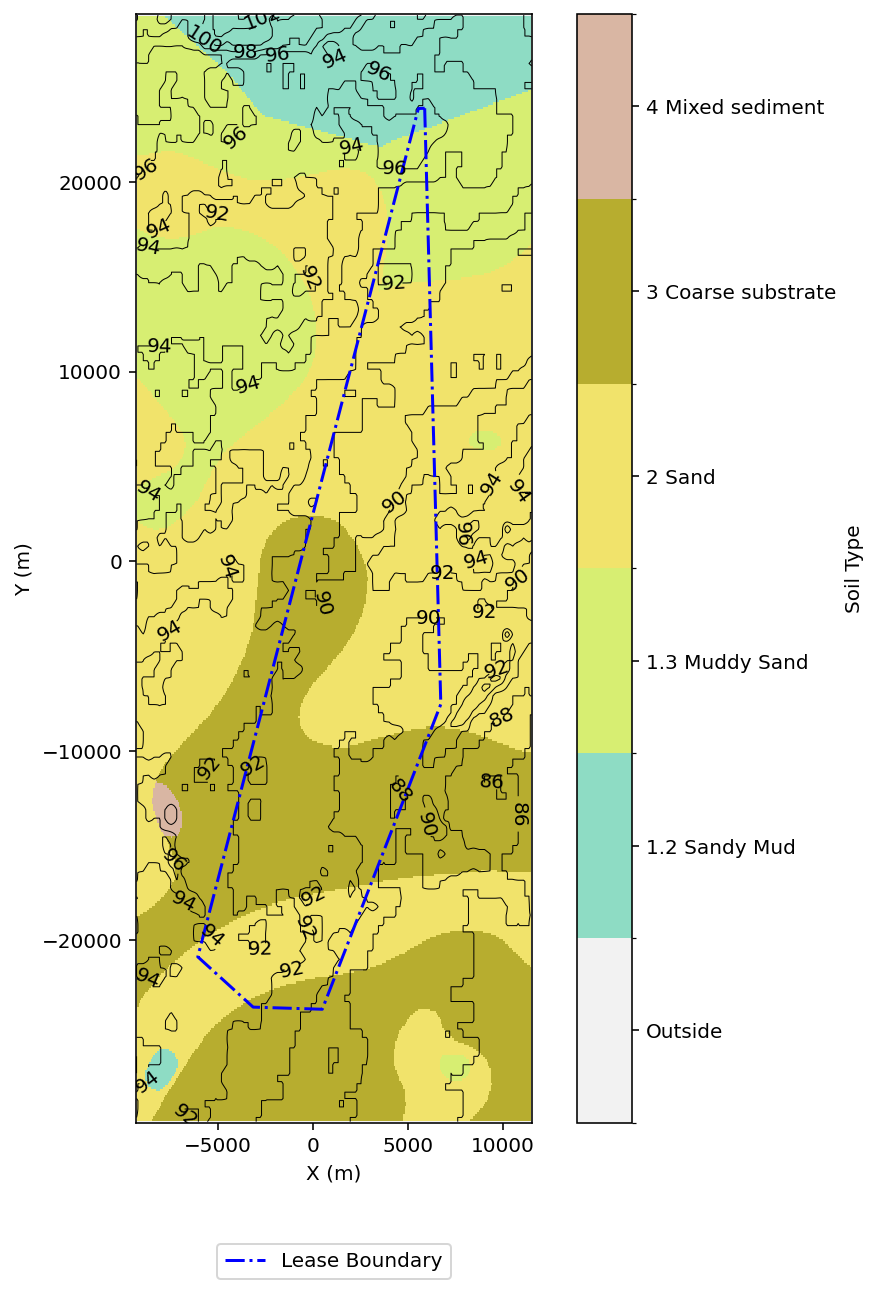
Figure 2 – Standardized seabed classification resource derived from the EMODnet Folk-7 system.
Engineering Significance
Together, these standardized engineering resources define:
- The feasible deployment domain based on water depth
- The seabed conditions governing downstream anchor compatibility
- Engineering constraints for topology-driven template deployment
- The common environmental foundation shared across downstream Morie workflows
Suitability Region Detection
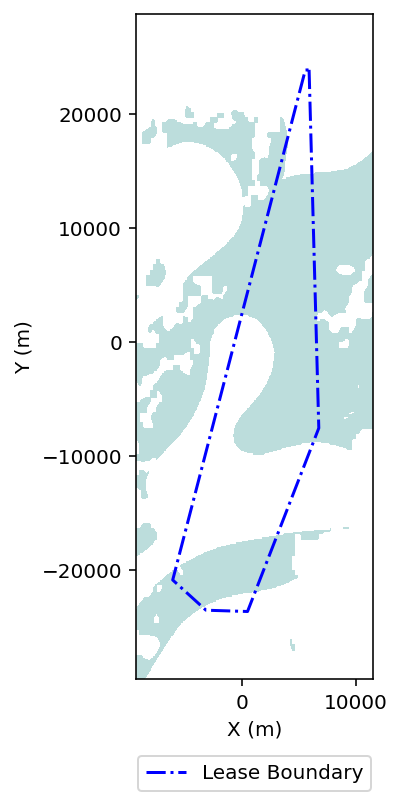
Figure 3 – Engineering deployment domain derived from combined bathymetry and seabed suitability criteria.
Engineering Criteria
The deployment domain is established by combining representative engineering constraints:
- Water depth: 88–94 m
- Seabed conditions: EMODnet Folk-7 sediment classes preliminarily compatible with the selected anchor concept
- Lease boundary: Buffered to accommodate engineering and installation constraints
Engineering Significance
The resulting suitability region defines the engineering deployment domain where:
- Standardized floating wind system configurations can be consistently deployed
- Mooring system layouts remain coherent across the site
- Selected anchor concepts remain preliminarily compatible with the environmental conditions
- Installation methodologies can be standardized at the cluster scale
Rather than identifying isolated feasible locations, this process establishes a continuous engineering domain suitable for reproducible topology-driven layout generation.
Hexagonal Lattice Generation
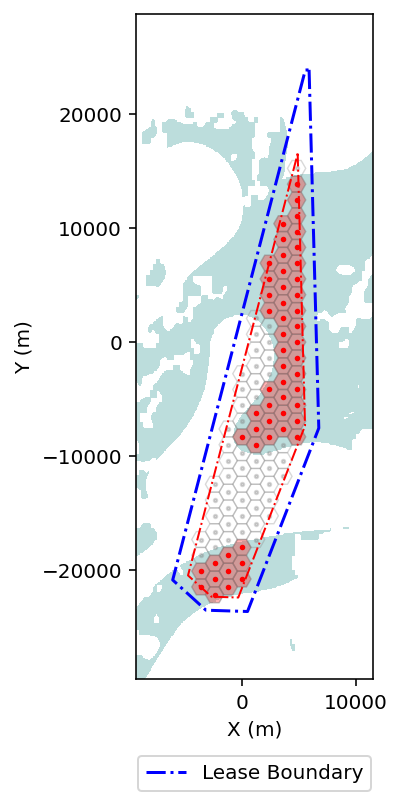
Figure 4 – Constrained hexagonal lattice defining the standardized deployment framework.
The constrained hexagonal lattice provides a deterministic spatial framework for engineering template deployment. Its uniform neighbour relationships and consistent spacing facilitate the evaluation of shared-anchor connectivity, mooring system standardization and downstream engineering compatibility.
Engineering Parameters
- Spacing: 800 m
- Lease setback buffer: 400 m
- Lattice orientation: 30°
The selected spacing is adopted as a representative engineering configuration for this study and should not be interpreted as an aerodynamically optimized arrangement for commercial-scale deployment.
Engineering Significance
The constrained hexagonal lattice provides:
- A standardized deployment framework
- Uniform floater spacing and neighbour relationships
- Deterministic and reproducible engineering template deployment
- Compatibility with shared-anchor system layouts
- A consistent spatial foundation for downstream wake, mooring and anchor analyses
Engineering Template Selection
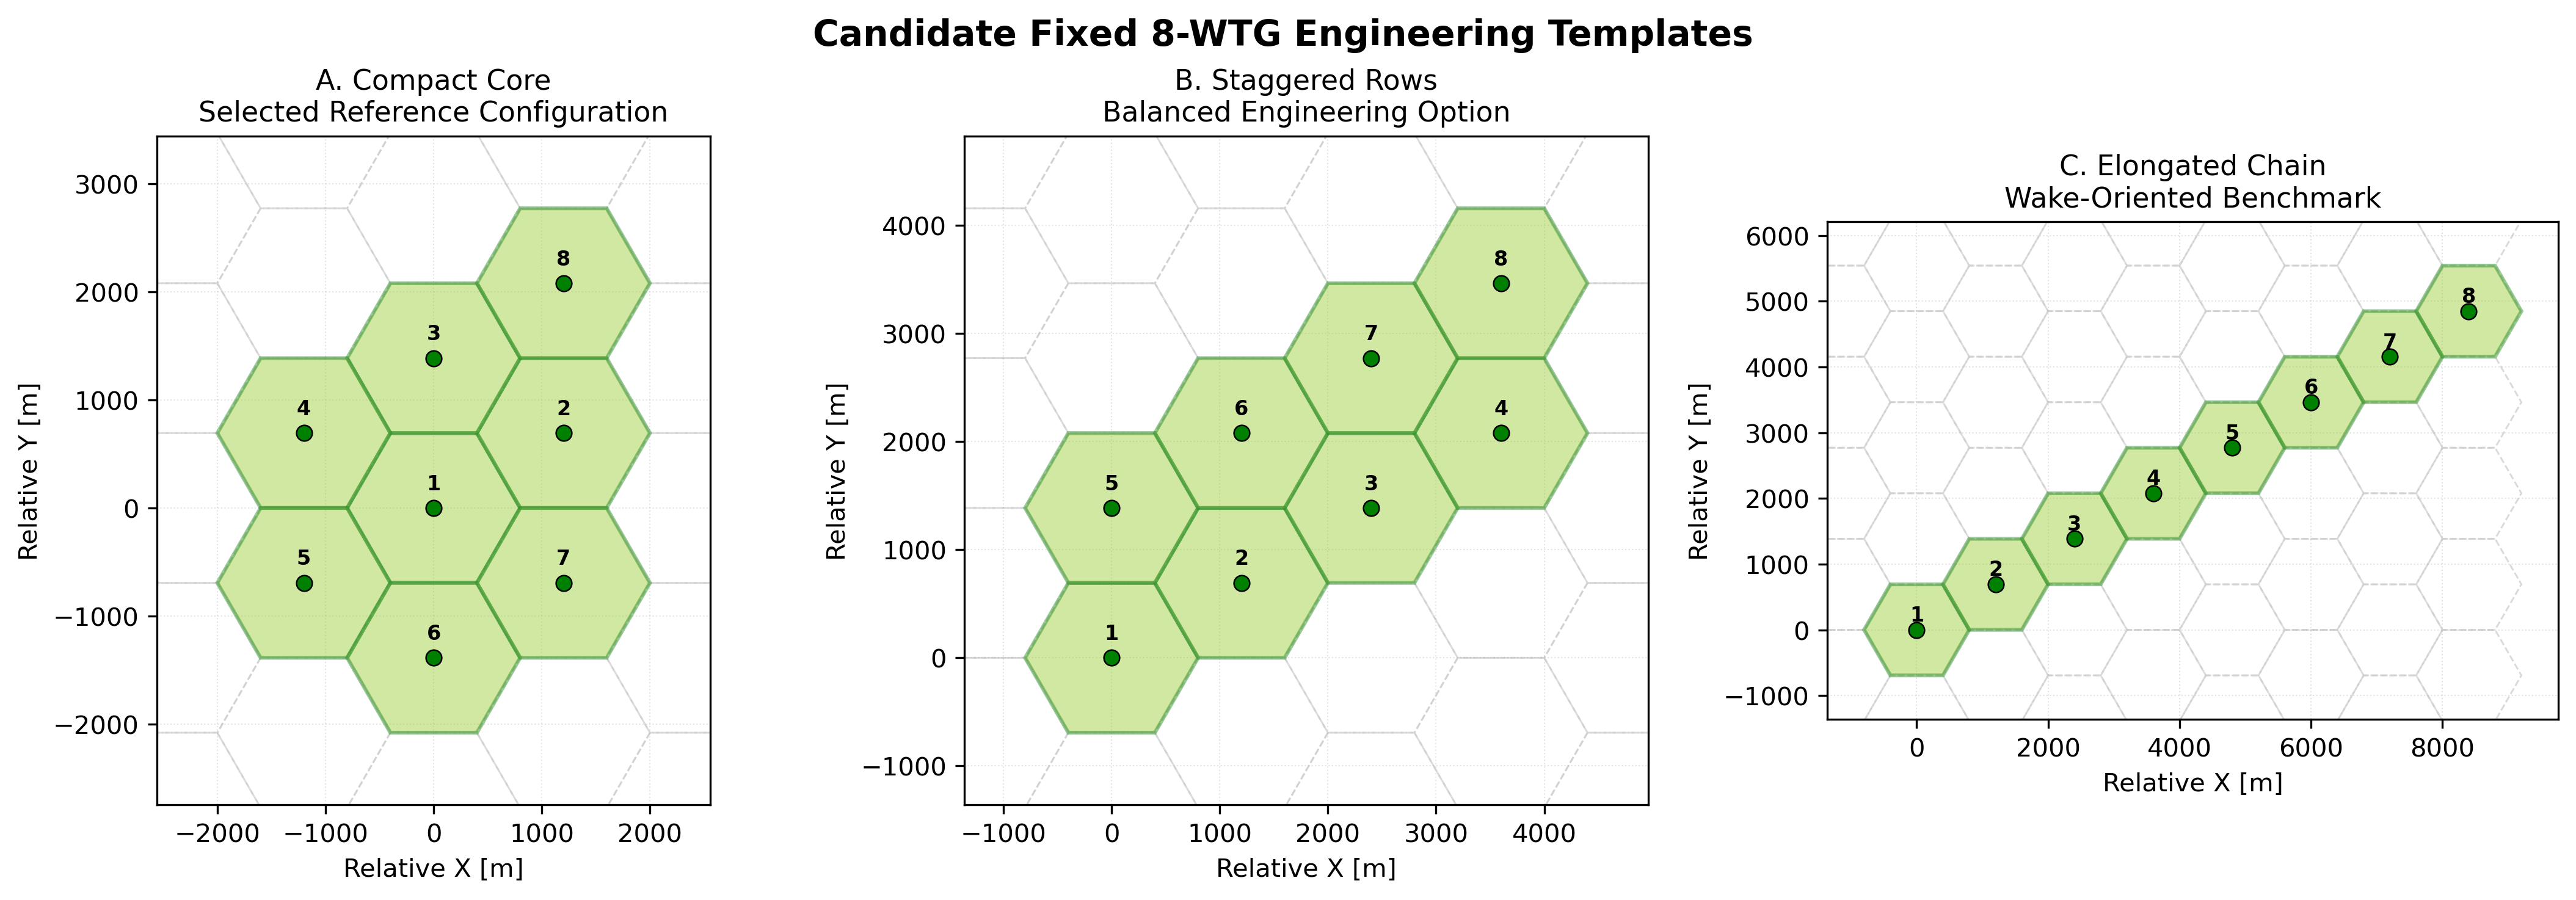
Figure 5 – Representative engineering templates evaluated prior to site-constrained deployment.
Rather than optimizing arbitrary turbine positions, morie_layout adopts an engineering template-based methodology, in which representative floating offshore
wind configurations are evaluated before deployment within the feasible engineering domain.
This approach separates engineering concept selection from site-constrained deployment, allowing different spatial topologies to be assessed using consistent engineering criteria before introducing local environmental constraints. By selecting an engineering concept first and subsequently determining its optimal deployment location, the workflow establishes a transparent and reproducible engineering decision process.
Candidate Engineering Templates
Three representative 8-WTG engineering templates are considered:
- Compact Core — Selected reference configuration
- Staggered Rows — Balanced engineering alternative
- Elongated Chain — Wake-oriented benchmark
Each template represents a different engineering philosophy while maintaining the same installed capacity and the same underlying hexagonal lattice geometry.
Engineering Decision Matrix
The candidate engineering templates are assessed qualitatively using representative engineering criteria relevant to early-stage floating offshore wind design.
| Criterion | Compact Core | Staggered Rows | Elongated Chain |
|---|---|---|---|
| Shared-anchor connectivity | ★★★★★ | ★★★☆☆ | ★☆☆☆☆ |
| Wake performance | ★★★☆☆ | ★★★★☆ | ★★★★★ |
| Internal cable routing | ★★★★★ | ★★★☆☆ | ★★☆☆☆ |
| Mooring standardization | ★★★★★ | ★★★☆☆ | ★★☆☆☆ |
| Structural compactness | ★★★★★ | ★★★☆☆ | ★☆☆☆☆ |
| Engineering recommendation | ✅ Selected | ○ Alternative | ○ Benchmark |
Selection Rationale
The Compact Core configuration is selected as the reference engineering template for this study.
Although the elongated arrangement provides the lowest expected wake interaction and the staggered configuration offers a balanced compromise between aerodynamic and structural considerations, the Compact Core maximizes shared-anchor opportunities, minimizes intra-array cable routing and promotes standardized mooring layouts.
These characteristics align with the primary objective of this study: demonstrating an integrated engineering workflow in which topology, wake assessment and downstream engineering analyses are evaluated within a common floating offshore wind framework.
Future versions of morie_layout will extend this qualitative decision process through quantitative multi-criteria assessment, incorporating wake performance, geohazards,
installation constraints, cable routing and techno-economic metrics alongside anchor connectivity.
Engineering Template Deployment
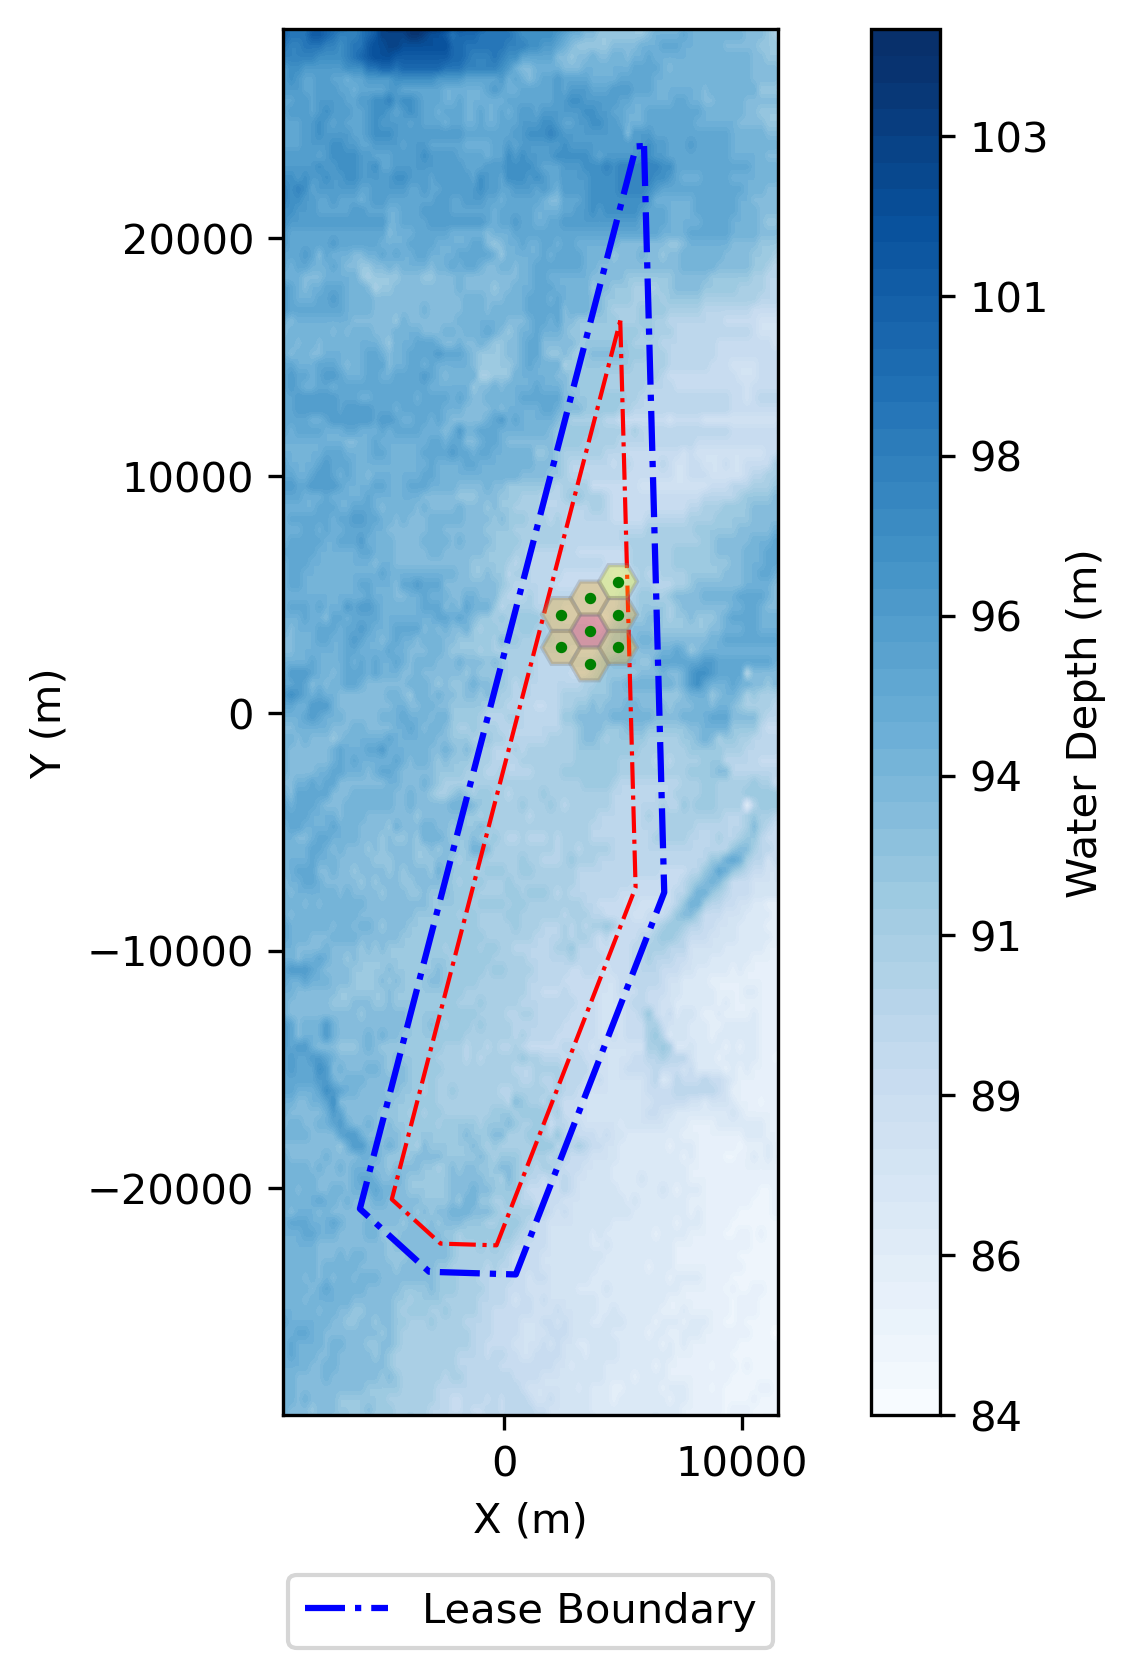
Figure 6 – Deployment of the selected engineering template across the constrained hexagonal lattice.
Following engineering template selection, the Compact Core reference configuration is systematically deployed throughout the engineering deployment domain.
Rather than searching for arbitrary turbine locations, the workflow evaluates feasible deployment positions while preserving the predefined engineering topology. This separation between engineering concept selection and site-constrained deployment provides a transparent and reproducible methodology for early-stage floating offshore wind design.
Deployment Workflow
- Position the selected engineering template on each feasible lattice location
- Verify that all floating wind turbines remain within the engineering deployment domain
- Evaluate the resulting spatial configuration
- Assess topology, engineering compatibility and wake performance
- Select the reference deployment for downstream engineering analyses
Topology-Driven Screening
Each candidate deployment is evaluated using the Topological Compactness Index (TCI), a spatial screening metric designed to identify engineering configurations with strong shared-anchor potential.
The TCI evaluates the local connectivity of each floating wind turbine within the deployed engineering template, providing a first-order indication of the structural compactness required for efficient shared-anchor layouts.
The metric is intentionally limited to topological screening and should not be interpreted as:
- A wake optimization metric
- An annual energy production (AEP) indicator
- A hydrodynamic performance metric
- A techno-economic optimization metric
Instead, it identifies engineering configurations suitable for downstream multidisciplinary assessment, where topology, mooring behaviour, anchor capacity and energy production are evaluated through dedicated engineering models.
Wake Assessment
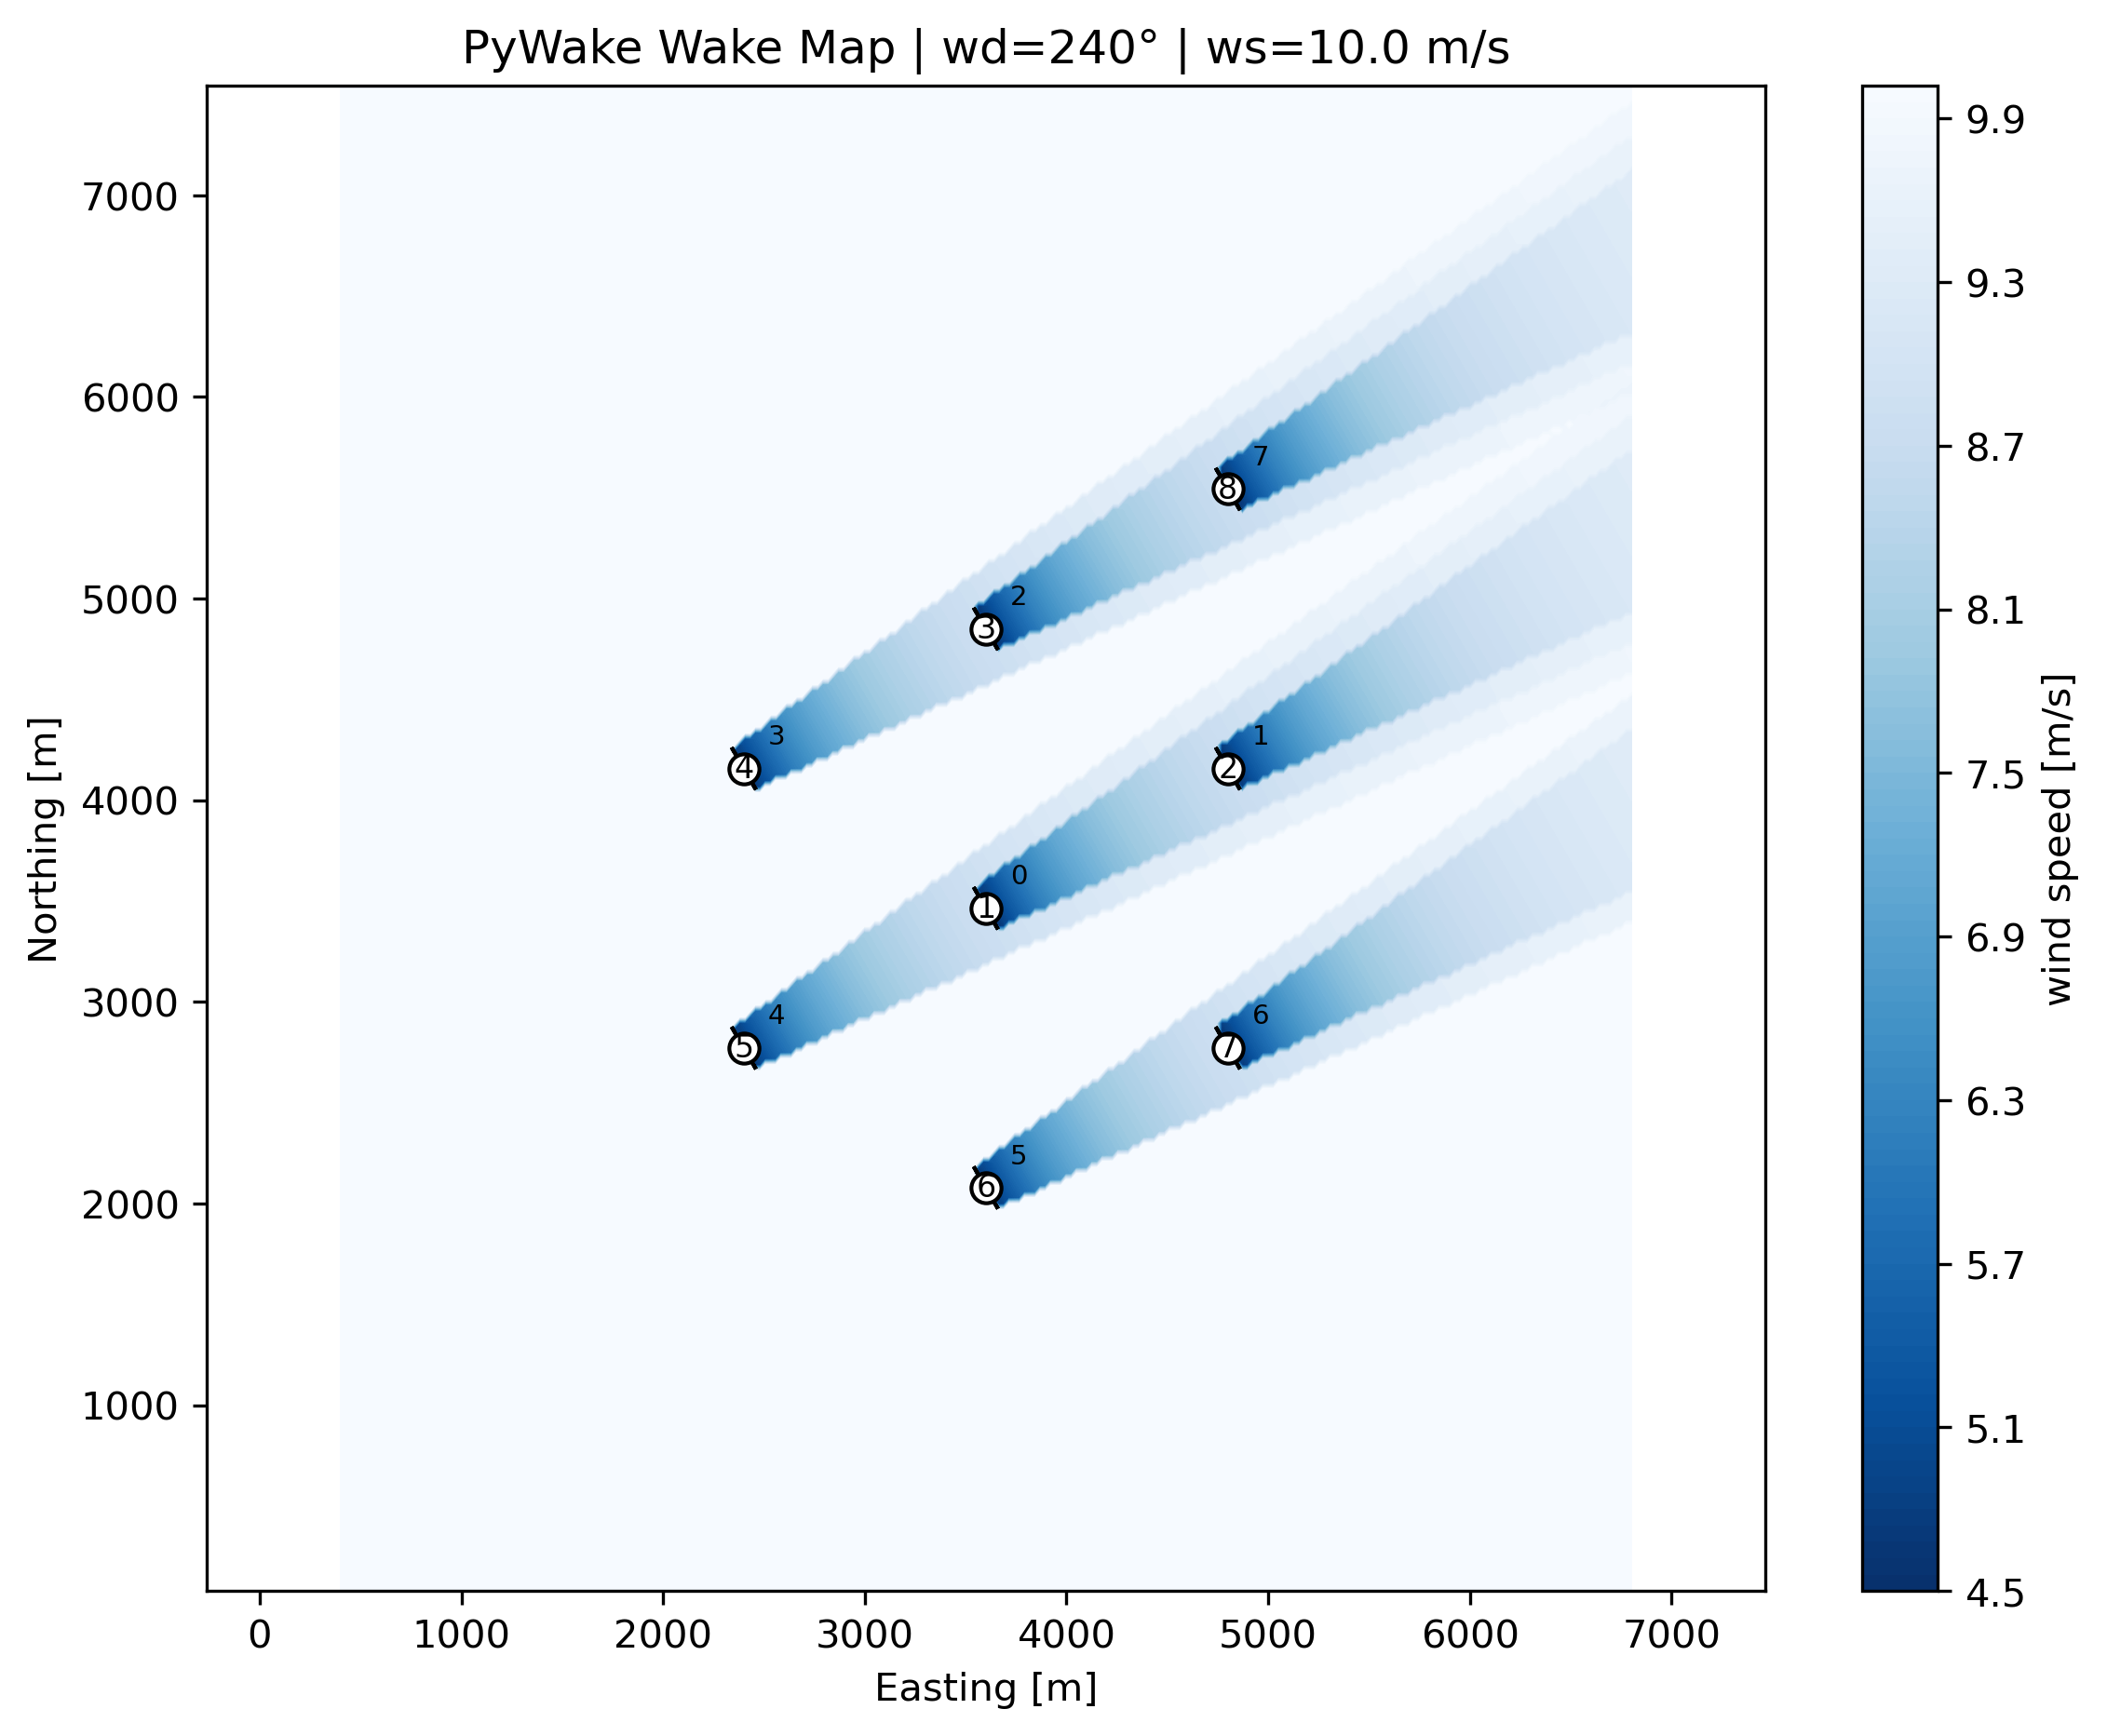
Figure 7 – Wake deficit map generated with PyWake for the selected engineering template.
Following deployment, the selected engineering configuration is evaluated using PyWake to estimate wake interactions and annual energy production.
Wake assessment provides an additional engineering performance indicator while remaining independent of the topology-driven deployment methodology, enabling aerodynamic performance to be assessed without modifying the underlying engineering configuration.
Mooring & Anchor Topology Generation
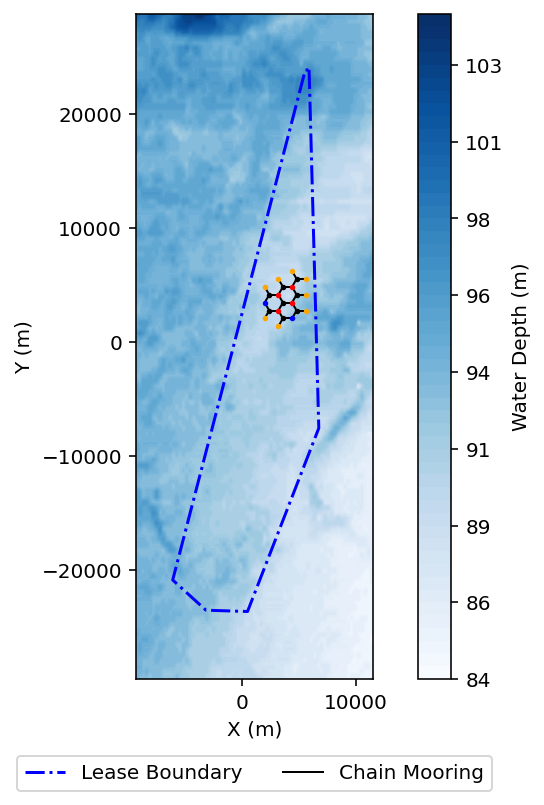
Figure 8 – Shared-anchor topology generated automatically from the deployed engineering configuration.
Once the selected engineering configuration has been written into the project ontology, the corresponding mooring systems are automatically instantiated and the anchor network is generated.
Coincident anchor locations are subsequently merged into shared-anchor configurations, transforming the deployed spatial layout into a structural load-transfer network suitable for downstream engineering analyses.
Generated Engineering Resources
- Anchor coordinates
- Shared-anchor configurations
- Attachment classification (1–3 mooring lines per anchor)
- Shared-anchor topology maps
Engineering Significance
This stage establishes the engineering interface between spatial deployment and foundation design by defining:
- Structural load-transfer pathways
- Shared-anchor opportunities across the array
- Engineering inputs for anchor sizing and capacity assessment
- The foundation topology for downstream mooring, geohazard and installation workflows
Rather than representing a simple geometric arrangement, the resulting shared-anchor network defines how loads are transmitted through the floating wind farm and provides the structural foundation for subsequent multidisciplinary engineering analyses.
System-Level Representation
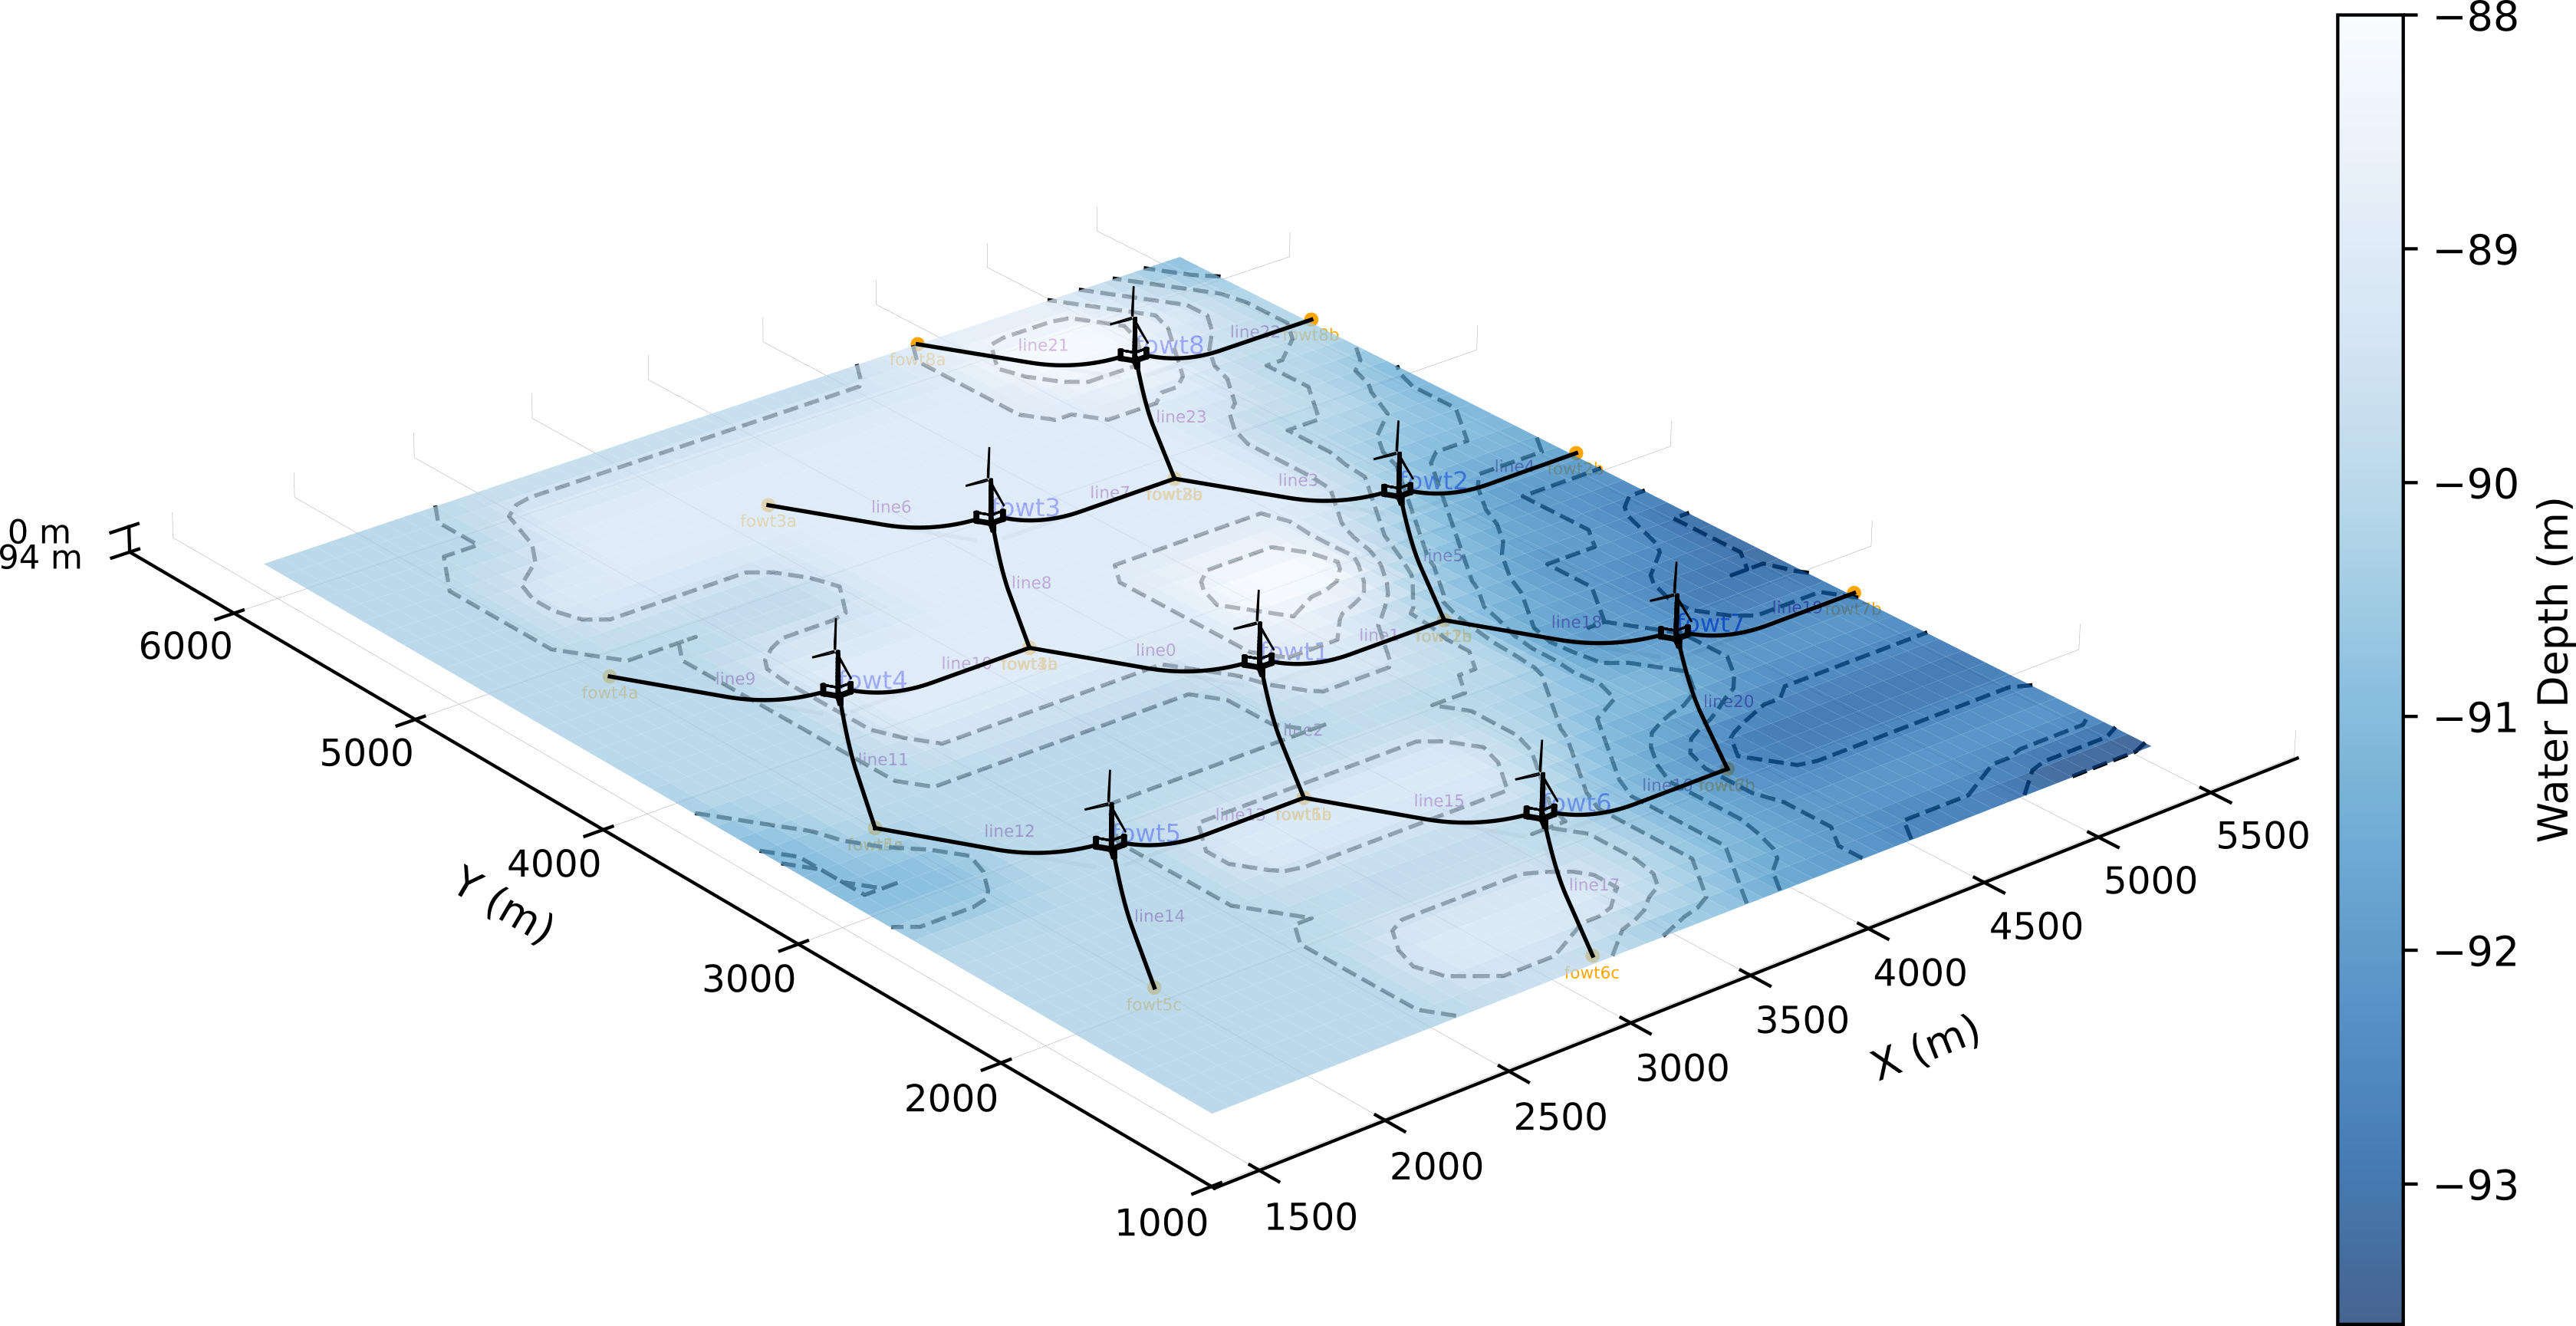
Figure 9 – Integrated engineering system combining environmental characterization, deployed layout, mooring systems and shared-anchor topology.
Engineering Significance
This visualization represents the transition from engineering template deployment to an integrated floating offshore wind system.
It captures:
- Bathymetry-driven deployment of the engineering configuration
- Floating wind turbine positions and spatial topology
- Mooring system geometry and orientation
- Shared-anchor topology and structural load pathways
- Interaction between the floating wind system and the subsea environment
This is the point where standardized environmental engineering resources, engineering template deployment and structural system generation converge into a single engineering representation ready for downstream multidisciplinary analyses.
Outputs Generated
For the selected engineering deployment, the workflow generates:
- Engineering template coordinates
- Project ontology and engineering model
- Engineering suitability maps
- Constrained lattice and deployment visualizations
- Shared-anchor topology maps
- Mooring system and anchor network definitions
These engineering resources are directly consumed by downstream Morie workflows, including:
- Mooring system modelling
- Anchor sizing and capacity assessment
- Dynamic cable routing
- Geohazard assessment
- Installation planning
Engineering Applications
The engineering resources generated by this workflow support:
- Engineering template evaluation and deployment
- Floating wind farm layout feasibility assessment
- Shared-anchor topology development
- Mooring system standardization
- Preliminary anchor sizing and capacity assessment
- Dynamic cable routing workflows
- Farm-scale engineering planning
By transforming standardized environmental engineering resources into engineering-ready system configurations, the workflow establishes a common spatial foundation for downstream multidisciplinary analyses throughout the Morie ecosystem.
This enables:
Manual layout generation → Engineering-driven floating offshore wind system design
Relationship to Other Morie Study Cases
Receives from
- morie_site → standardized environmental engineering resources, including bathymetry, seabed characterization, lease geometry and representative wind resource data.
Provides to
- morie_soil → engineering template coordinates for localized subsurface reconstruction and spatial soil variability assessment.
- morie_mooring → deployed engineering configuration, project ontology and mooring system definitions for equilibrium and load analyses.
- morie_anchor → shared-anchor topology, anchor coordinates and attachment relationships for anchor sizing and capacity verification.
- morie_cable → floating wind turbine locations, shared-anchor topology and engineering geometry for dynamic cable routing and configuration.
- morie_geohazard → engineering deployment layouts for hazard screening, seabed mobility assessment and constraint evaluation.
- morie_install (future) → standardized engineering configurations supporting installation planning and logistics assessment.
This study case transforms environmental engineering resources into engineering-ready floating offshore wind system configurations, providing the spatial engineering foundation that connects site characterization with downstream multidisciplinary engineering workflows across the Morie Analytics ecosystem.
Why It Matters Commercially
Spatial configuration decisions strongly influence project CAPEX, installation strategy, operational performance and long-term engineering feasibility.
By standardizing engineering template deployment within a reproducible workflow, this study enables:
- Reduced uncertainty during early-stage project development
- Rapid comparison of alternative engineering configurations
- Improved shared-anchor utilization and infrastructure efficiency
- Standardized inputs for downstream engineering analyses
- Scalable floating wind farm planning across multiple development sites
This is where:
- Engineering templates become strategic design assets
- System configuration drives project cost and engineering performance
- Reproducible engineering workflows replace heuristic layout generation
Aspects to Improve
The current workflow establishes a reproducible methodology for engineering template selection and deployment. Several extensions would further strengthen its applicability to commercial floating offshore wind developments:
- Multi-template and multi-cluster optimization across lease-scale developments
- Quantitative multi-objective assessment combining topology, wake performance and engineering constraints
- Integration of dynamic cable routing and installation constraints into template deployment
- Geohazard-aware engineering template assessment through downstream Morie workflows
- Techno-economic evaluation incorporating installation, infrastructure and lifecycle considerations
- AI-assisted engineering template exploration for rapid design space assessment
These developments would extend the workflow from deterministic engineering template deployment toward fully integrated engineering decision support for floating offshore wind planning.
Design Philosophy
The objective of this study is not to optimize a single floating offshore wind layout, but to establish a transparent and reproducible engineering methodology for transforming standardized environmental engineering resources into engineering-ready spatial system configurations.
Rather than treating layout generation as an isolated geometric exercise, the workflow separates engineering template selection from site-constrained deployment, enabling representative floating wind concepts to be evaluated consistently before entering downstream physics-based analyses.
This study reflects the Morie Analytics approach:
- Engineering-driven
- Physics-informed
- Modular
- Reproducible
- Traceable
- Scalable
Within the Morie ecosystem, morie_layout provides the spatial engineering foundation that connects environmental characterization with mooring systems, anchor design, cable routing and
future multidisciplinary engineering workflows.