Shared Anchor Load Resolution & Capacity Verification
Celtic Sea Floating Offshore Wind – Shared Anchor Load Resolution & Capacity Verification
Executive Summary
This study establishes the geotechnical verification layer of Morie Analytics by transforming mooring-derived loads into capacity-assessed anchor evaluation.
The workflow identifies the governing event, extracts concomitant loads, transfers them through embedded chain mechanics to main padeye elevation, resolves shared-anchor demand and verifies suction pile capacity.
The result is a reproducible framework connecting system response, load transfer and geotechnical resistance.
This module represents the point where mooring demand and soil resistance are combined into preliminary geotechnical design assessment.
Site intelligence → Layout generation → Soil reconstruction → Mooring physics → Anchor verification → Cable optimization
Project Scope
- Governing event identification
- Concomitant load extraction
- Load transfer from mudline to main padeye
- Shared-anchor load resolution
- Capacity verification
This study converts mooring loads into geotechnically assessed anchor design.
Engineering Context
Shared anchors reduce cost but introduce:
- Multi-directional loading
- Accumulation of vertical uplift and torsional effects
- Complex soil–structure interaction
The key principle is:
Design must be based on simultaneous padeye load conditions, not isolated maxima at mudline elevation.
This workflow ensures a consistent transition from system mechanics to geotechnical verification.
Inputs and Data Sources
This study builds directly on upstream Morie Analytics outputs:
From morie_site
- Bathymetry and soil classification grids
- Lease boundary definitions
From morie_layout
- Shared-anchor topology
- Connectivity
- Anchor coordinates
From morie_soil
- Layered soil profile
- Soil parameters
From morie_mooring
- Mudline loads
- Time series response
- Governing event
- Concomitant load states
Additional Inputs
- Chain properties
- Suction pile geometry
- Coupled capacity model parameters
This provides the load and resistance inputs required for anchor verification.
System Flow
Mooring Response → Critical Event → Load Transfer → Anchor Resolution → Capacity Check
The architecture ensures traceability from system loads to geotechnical verification.
Processing Workflow
- Load mooring results
- Identify governing event
- Extract concomitant loads
- Transfer loads from mudline to padeye
- Resolve shared-anchor load state
- Compute torsional demand
- Evaluate suction pile capacity
- Verify load–capacity interaction
This converts mooring loads into capacity-assessed anchor design.
Design Basis
This workflow is intended as a preliminary geotechnical assessment framework suitable for early-stage floating offshore wind studies.
The current implementation focuses on:
- Shared-anchor load aggregation
- Mudline-to-padeye load transfer
- Preliminary suction pile capacity assessment
- VHM interaction evaluation
- Soil-dependent anchor response
The workflow does not currently represent a fully code-qualified anchor design methodology.
The following aspects remain outside the present scope:
- Partial safety factor application
- Detailed cyclic degradation assessment
- Installation engineering verification
- Probabilistic geotechnical uncertainty
- Detailed finite-element soil–structure interaction analysis
These aspects would require integration with higher-fidelity geotechnical workflows and project-specific certification criteria.
Anchor System Topology
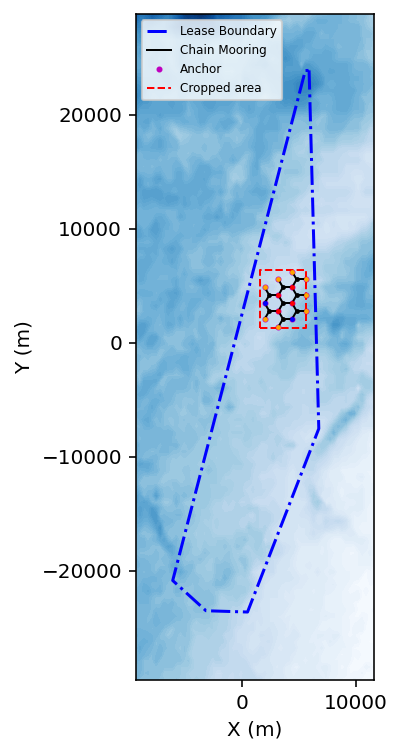
Figure 1 – Shared-anchor configurations across the floating wind farm.
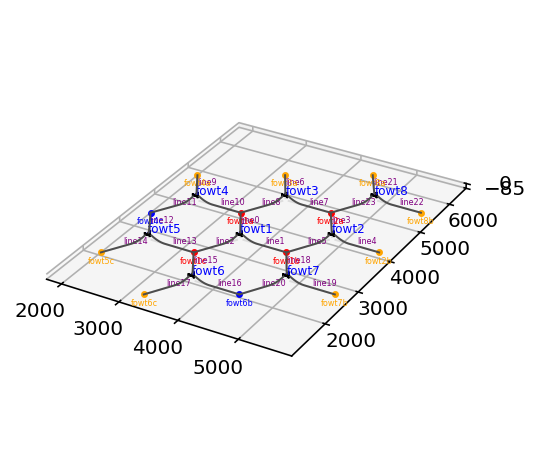
Figure 2 – Multiple mooring lines connected to shared anchors.
Engineering Interpretation
Shared anchors form a coupled load network, where:
- Multiple lines contribute simultaneously
- Load directions differ
- Vector combination governs demand
Critical Event & Concomitant Loads
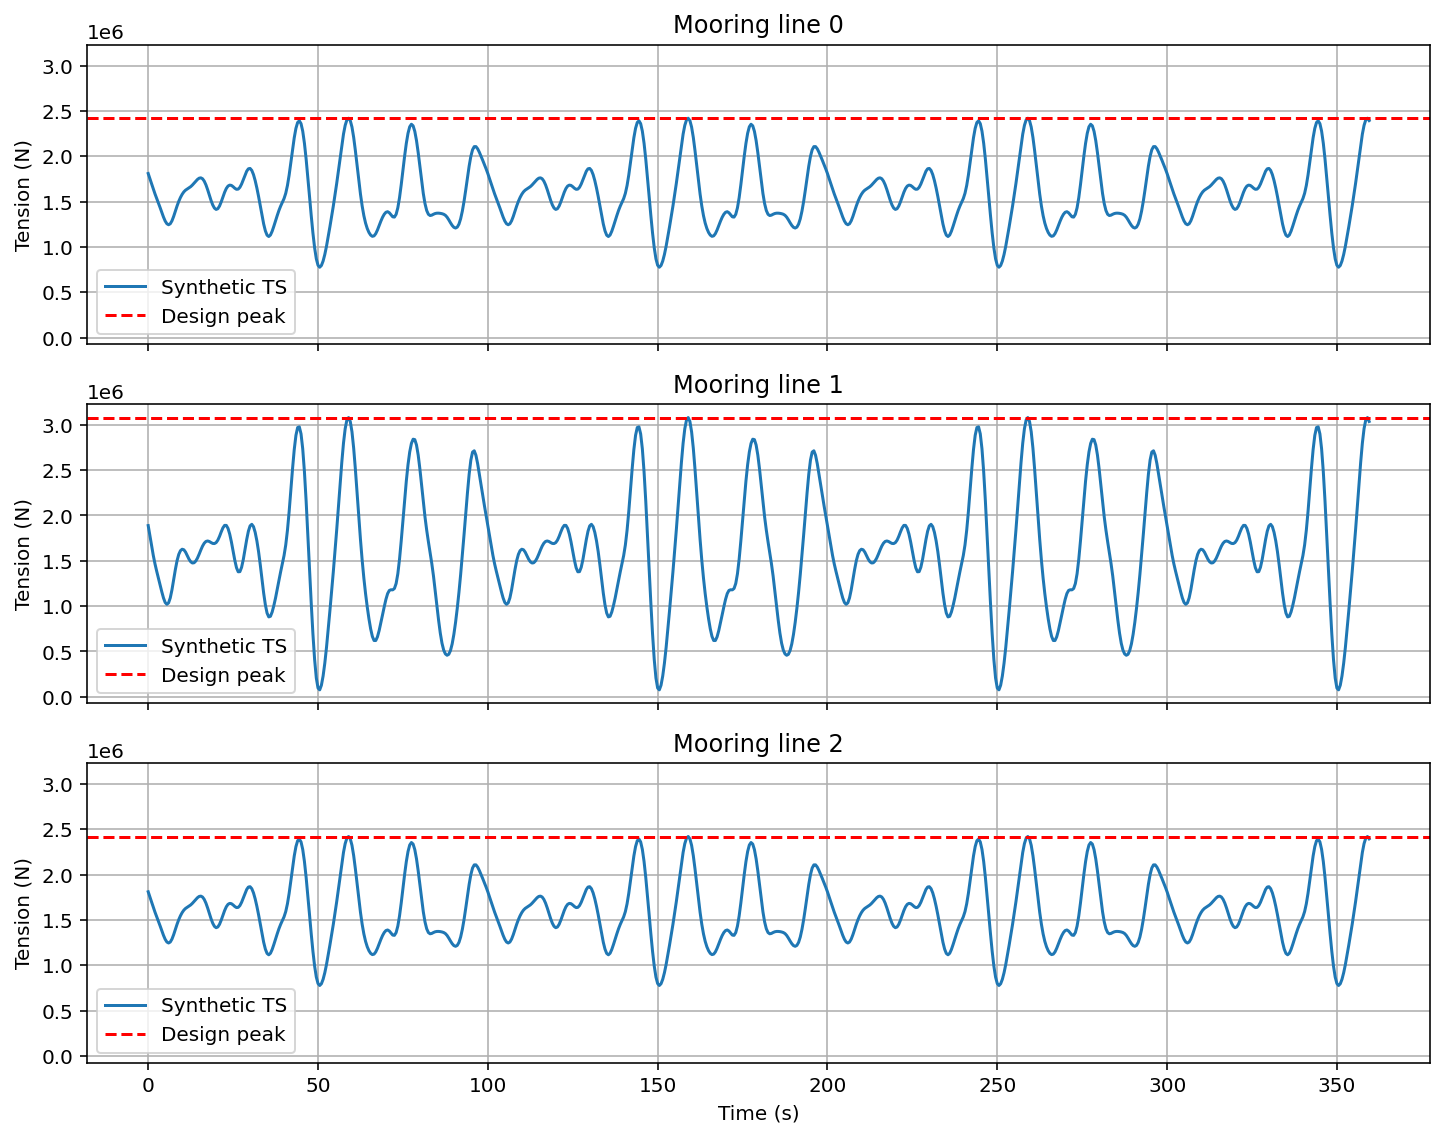
Figure 3 – Mooring tension time series.
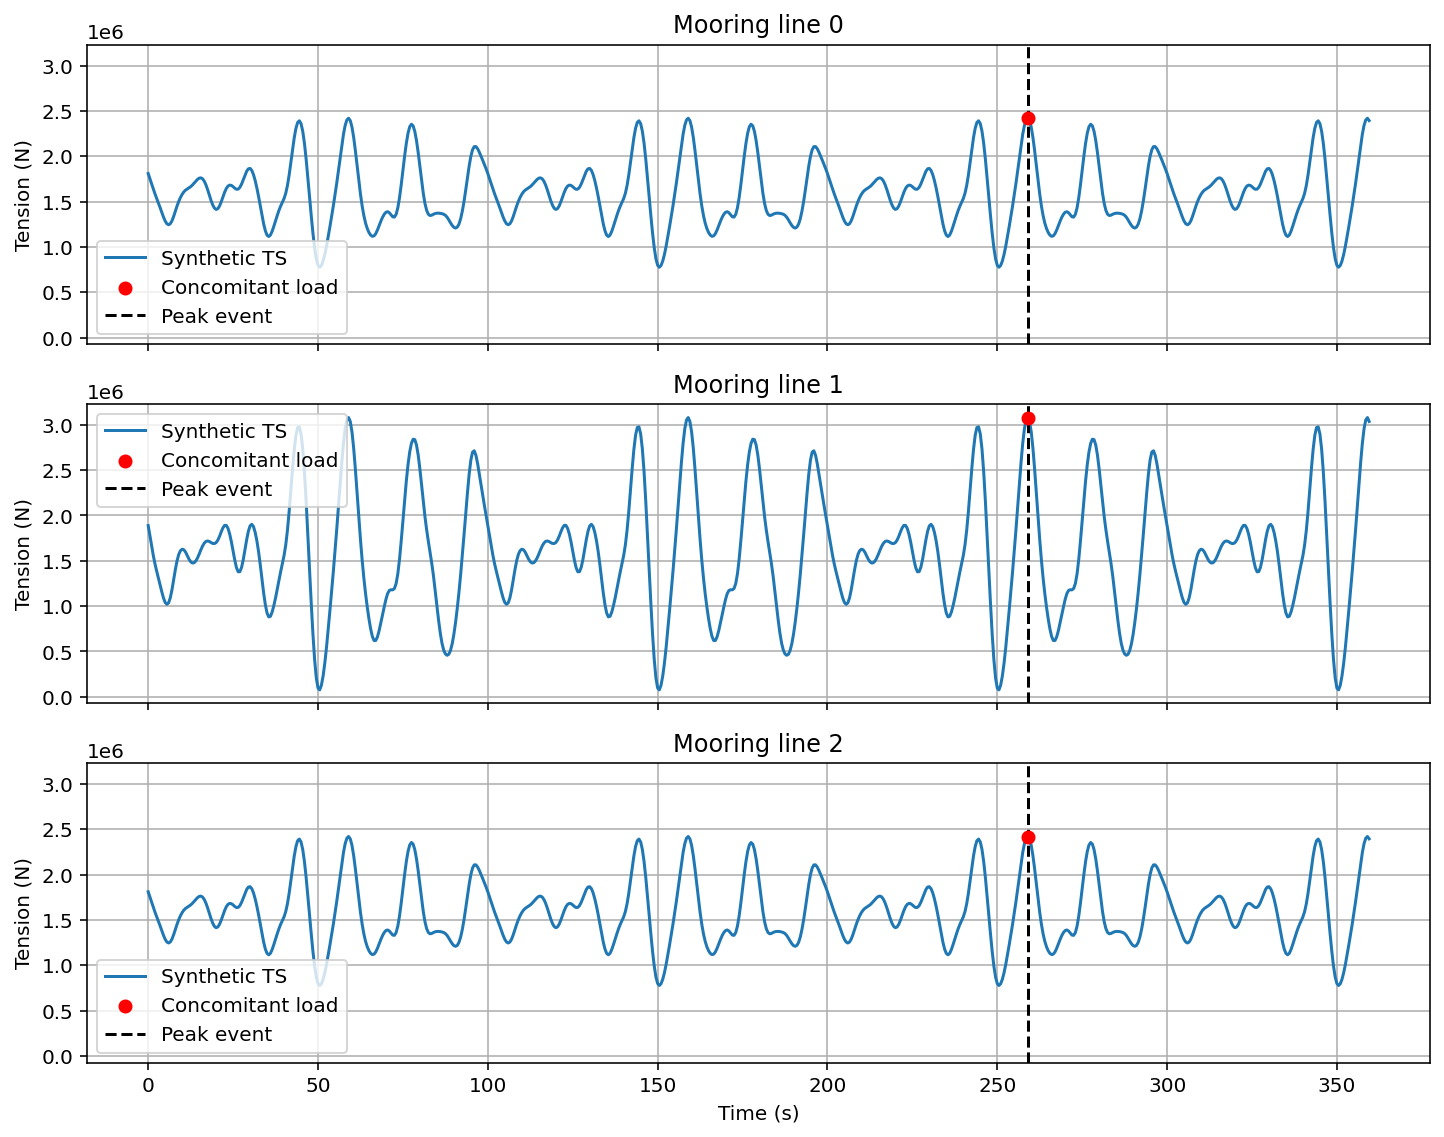
Figure 4 – Concomitant loads at peak event.
Engineering Interpretation
The anchor must be checked against simultaneous load conditions, not independent maxima, to avoid artificially conservative load combinations that may lead to unnecessary pile overdesign.
Anchor-Level Soil Profile (fowt1b)
The selected anchor fowt1b is exported with its fully reconstructed soil profile in a structured format (profile_map), directly usable in downstream anchor capacity models.
This structure represents the final engineering output of the soil and it was generated in the previous study case morie_soil.
Link with Soil Reconstruction
The transformation from mudline loads to padeye loads on sandy soils depends on:
- Soil friction angle (φ)
- Relative density (Dr)
- Embedded mooring line behavior
These parameters are provided by morie_soil, establishing a direct coupling between:
- Mooring response
- Soil-dependent load transfer
Load Transfer to Padeye
Loads from all connected lines are extracted at mudline elevation and transferred to the embedded padeye connection point through inverse catenary mechanics:
- Tension (Tm → Ta)
- Direction (θm → θa)
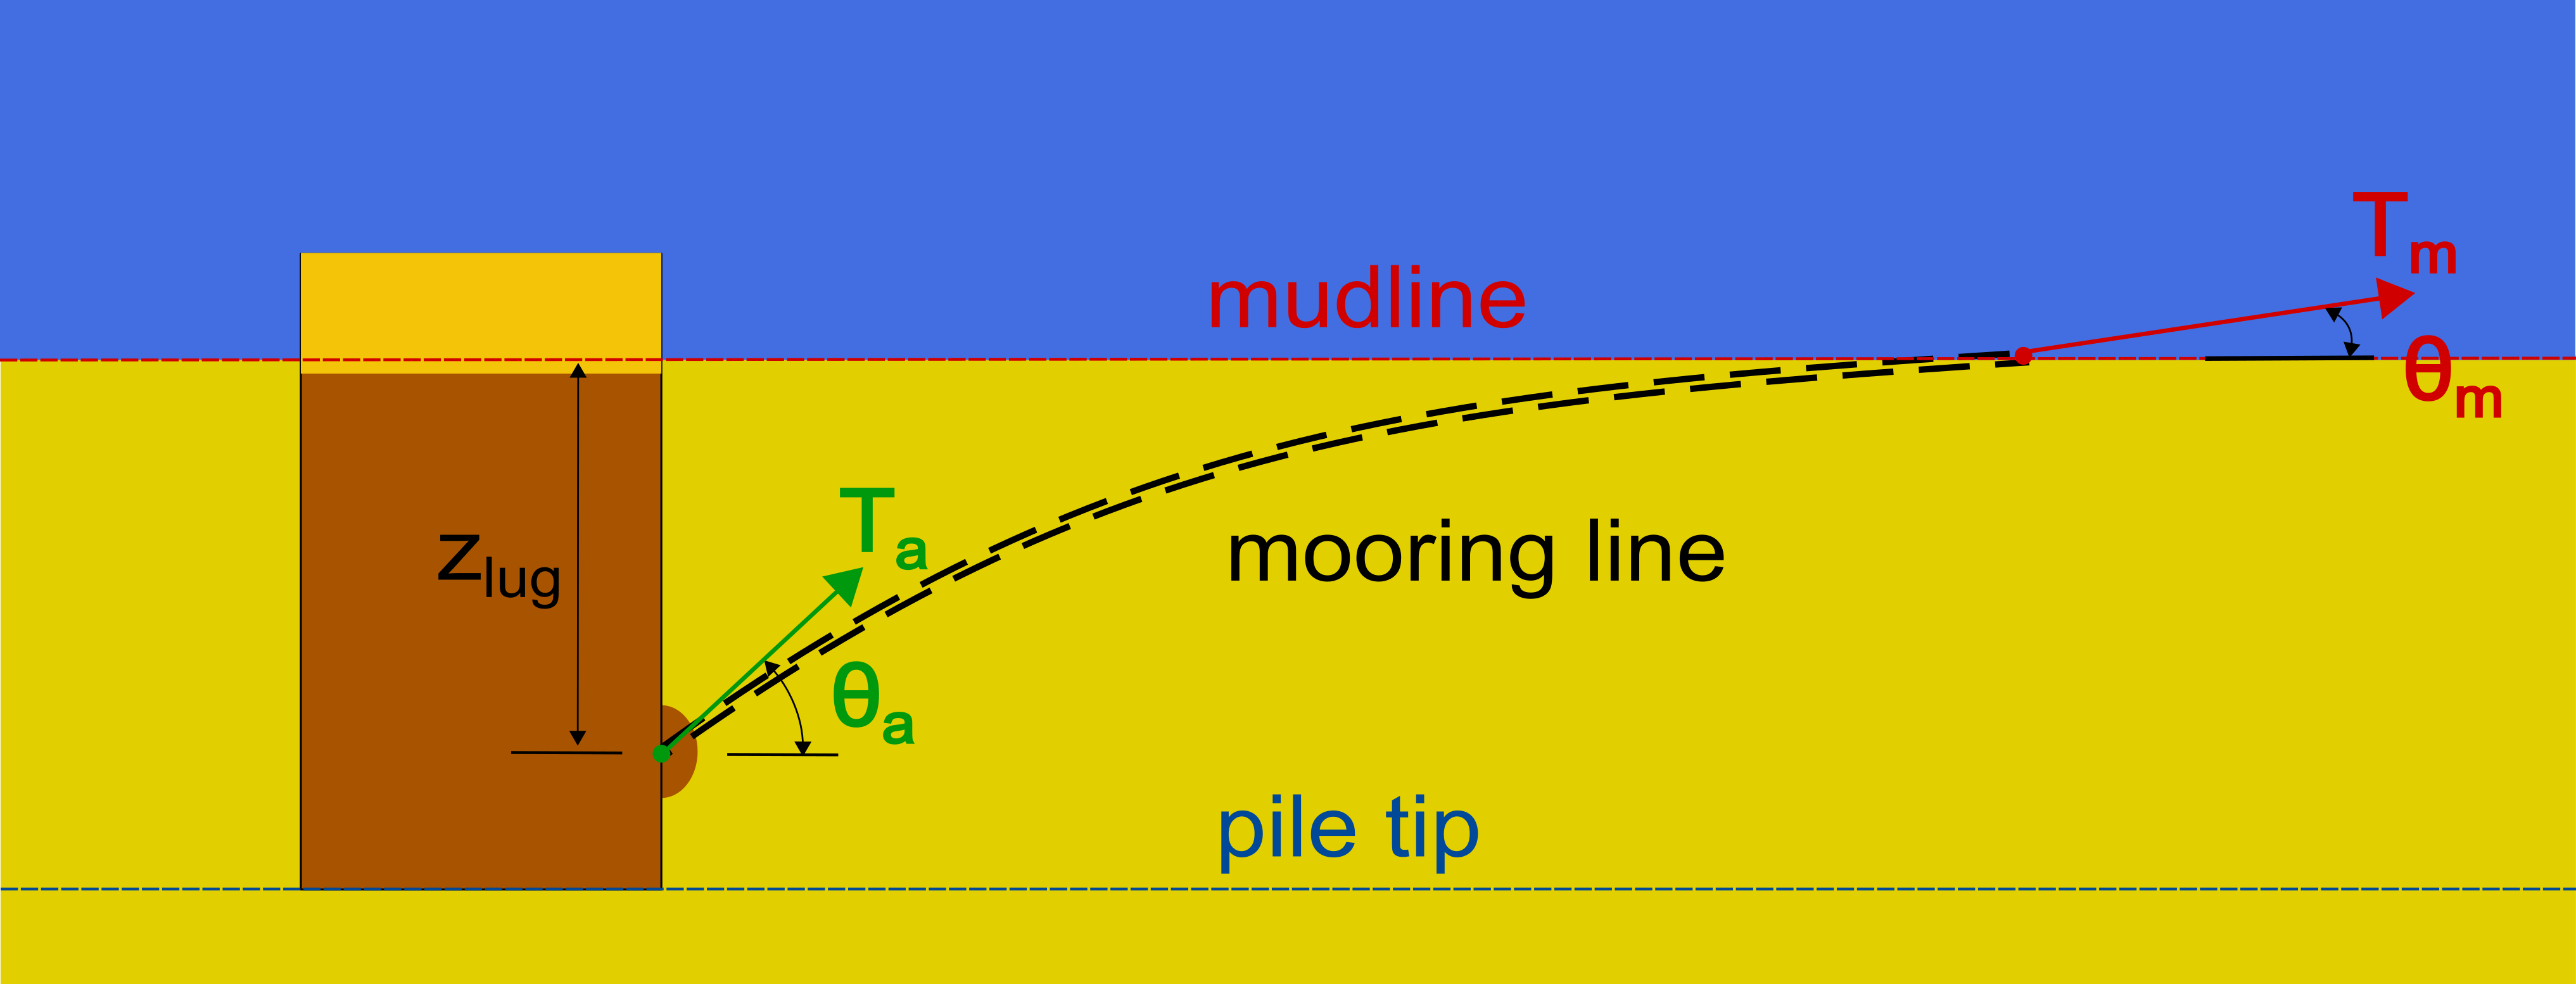
Figure 5 – Inverse catenary load transfer.
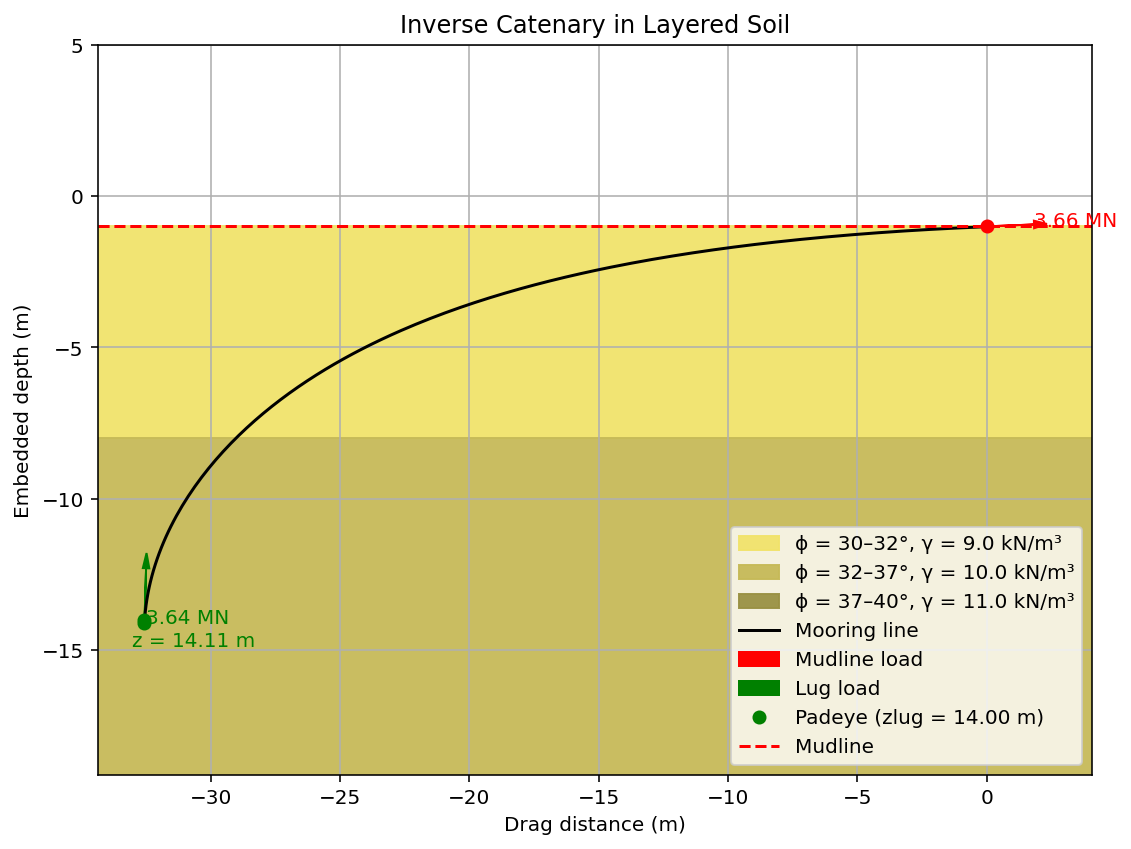
Figure 6 – Load transformation from mudline to padeye.
Engineering Interpretation
- Padeye loads govern anchor design as opposed to mudline loads
- Loads evolve along embedded chain, reducing the tension and increasing the angle with the horizontal plane
- Chain and soil properties influence load transfer
Anchor Load Aggregation
Loads from all connected lines are combined into a single anchor-level demand, integrating both vectorial force resolution and torsional effects. This enables the transition from a multi-line system to a unified load state suitable for capacity verification.
Shared Anchor Load Resolution
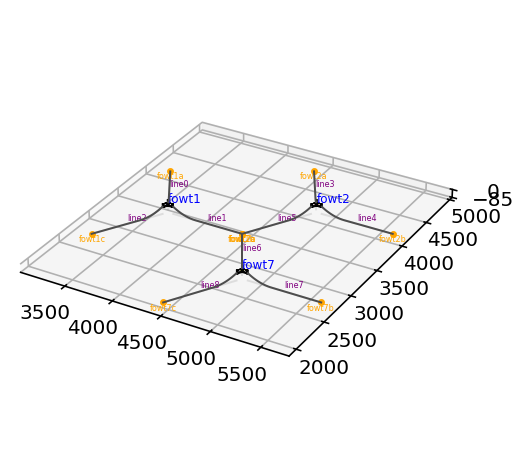
Figure 7 – Load vectors acting on a shared anchor.
Each line load is decomposed according to its directional contribution, allowing horizontal forces to be combined through vector summation into a single equivalent resultant. Vertical components are accumulated directly, forming a unified 3D force state at the anchor.
Torsional Effects
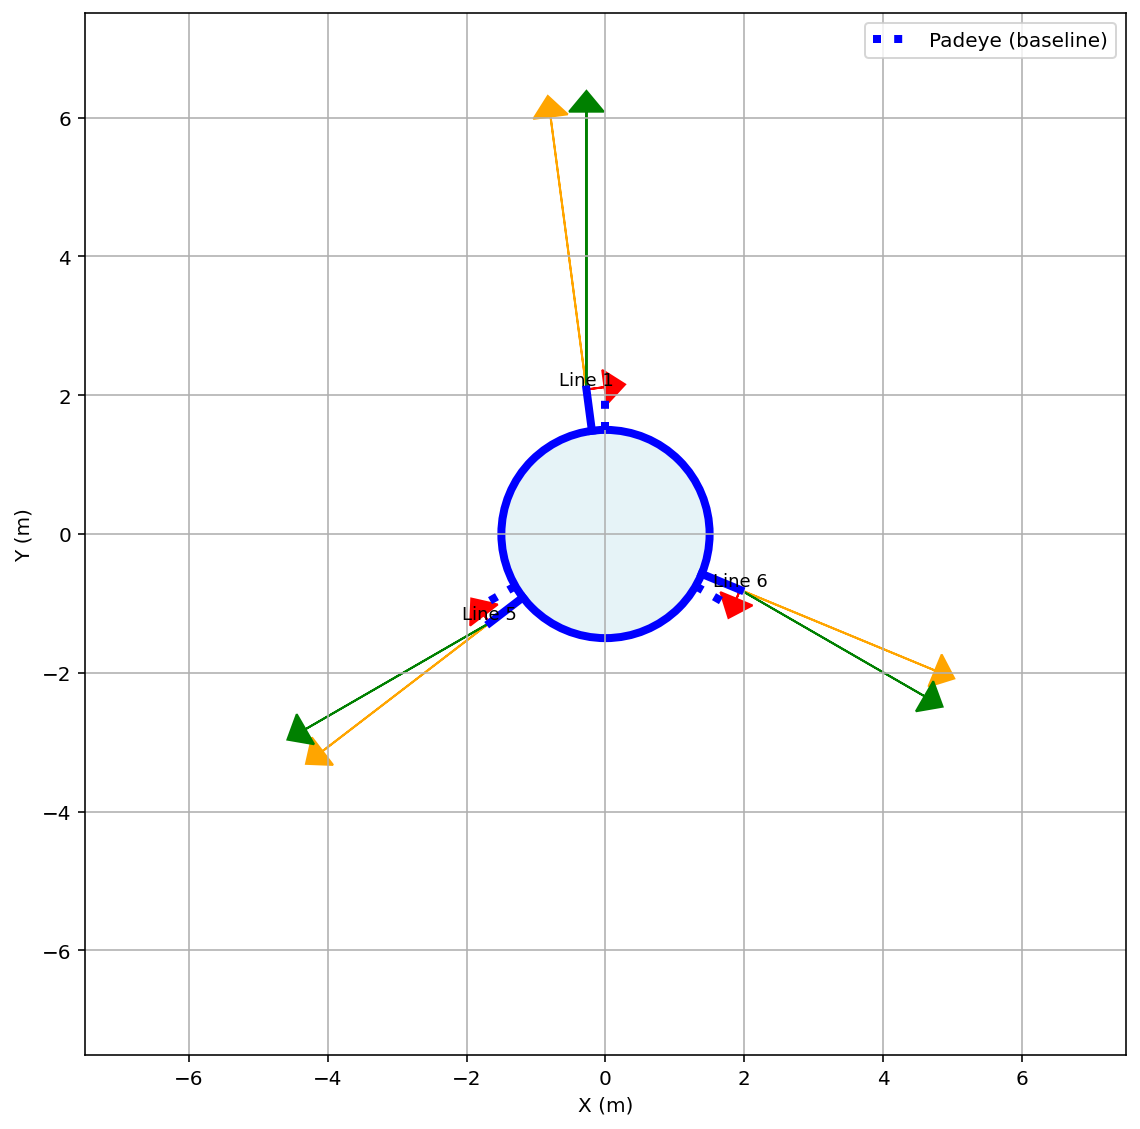
Figure 8 – Shared-anchor interaction.
In parallel, torsional demand arises from the misalignment between load directions and padeye geometry. Horizontal forces acting at an eccentricity generate rotational effects, with each line contributing to the overall torsional demand. The total torsion reflects the cumulative influence of all connected lines within the shared-anchor system.
Engineering Interpretation
This step converts:
Multiple line forces → Unified anchor-level load state single unified anchor-level load state
This is the critical interface between physics and design, where distributed mooring interactions are reduced to a single 3D load state with associated torsion, governing anchor capacity verification.
Suction Pile Coupled Capacity
The interaction model defines the admissible combinations of:
- Vertical load (V)
- Horizontal load (H)
- Overturning moment (M)
The resulting resistance domain forms a tongue-shaped VHM envelope derived from the Kay formulation for caissons in undrained soils. A load condition is considered feasible only if it lies within the interaction surface, ensuring that the governing resistance mechanisms remain within admissible limits.
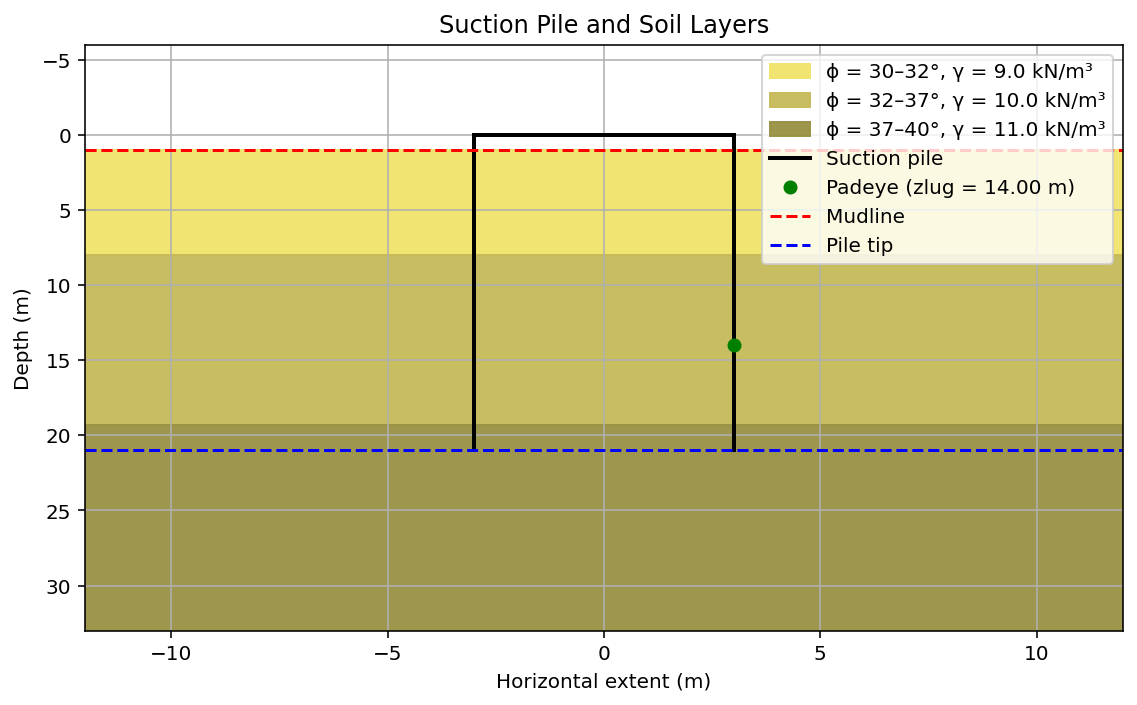
Figure 9 – Suction pile geometry.
The suction pile capacity is evaluated by considering both vertical and horizontal resistance mechanisms, which together define the admissible load domain of the anchor.
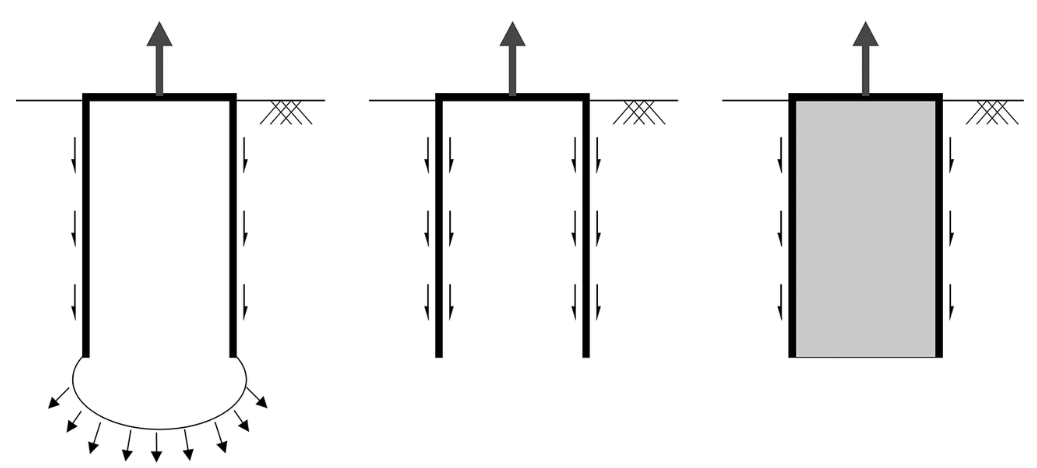
Figure 10 – Vertical failure mechanisms.
Vertical capacity is governed by a combination of failure modes, including reverse end bearing, shaft resistance and potential plug or soil failure mechanisms. The governing value is controlled by the most critical of these mechanisms depending on the loading conditions.
Horizontal capacity develops through lateral soil resistance mobilized along the embedded length of the pile. This response depends on soil strength, stiffness and the interaction between the pile and surrounding ground, with contributions from both shallow and deep failure mechanisms.
Engineering Interpretation
Capacity depends on:
- Pile geometry and slenderness ratio (L/D)
- Combined horizontal and vertical loading
- Load application point (padeye position)
- Layered soil profile and strength distribution
The anchor response is inherently multi-axial, where vertical and horizontal resistances are coupled and must be assessed together to define the feasible load envelope.
Load–Capacity Interaction Model
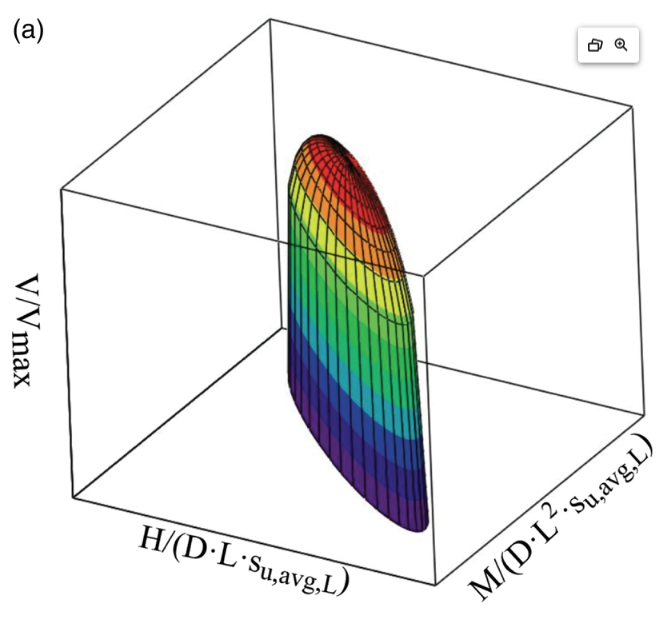
Figure 11 – Tongue-shaped 3D VHM resistance envelope following the Kay caisson formulation.
The tongue-shaped geometry of the VHM resistance envelope reflects the nonlinear interaction between vertical load, horizontal load and overturning moment in suction caissons under combined loading.
As one load component increases, the admissible capacity available for the remaining components progressively decreases, producing a coupled resistance domain rather than independent capacity limits. This interaction behavior is a defining characteristic of caisson response under multi-axial loading and forms the basis of the Kay / Kay & Palix preliminary assessment methodology adopted in this study.
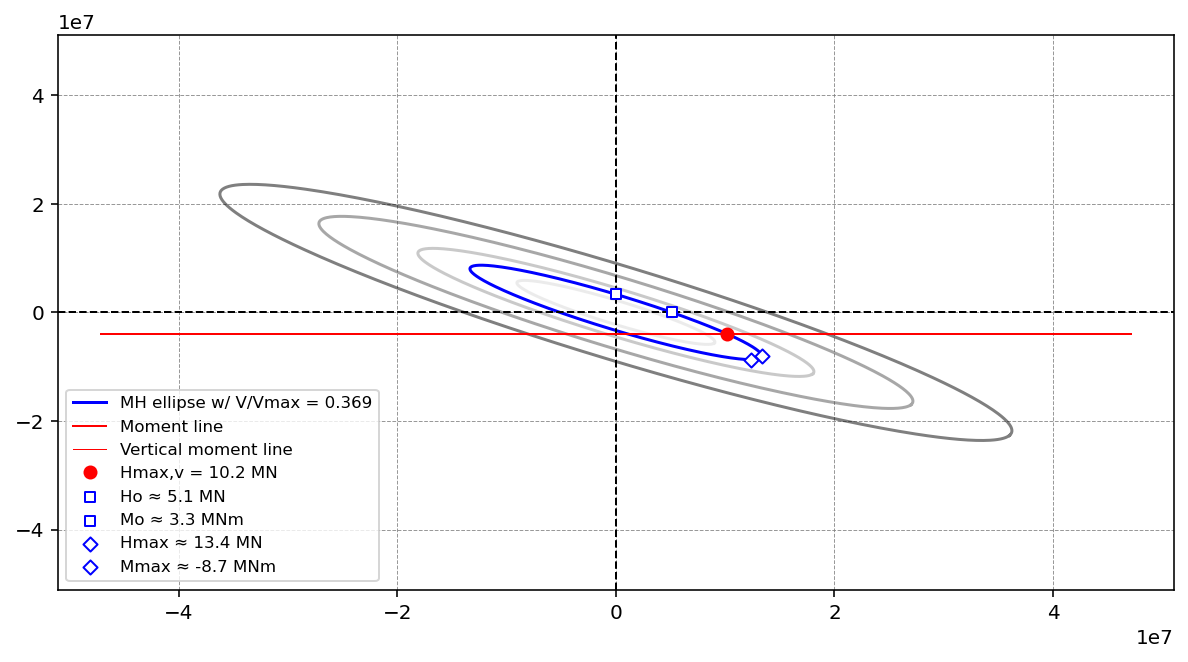
Figure 12 – VHM interaction surface.
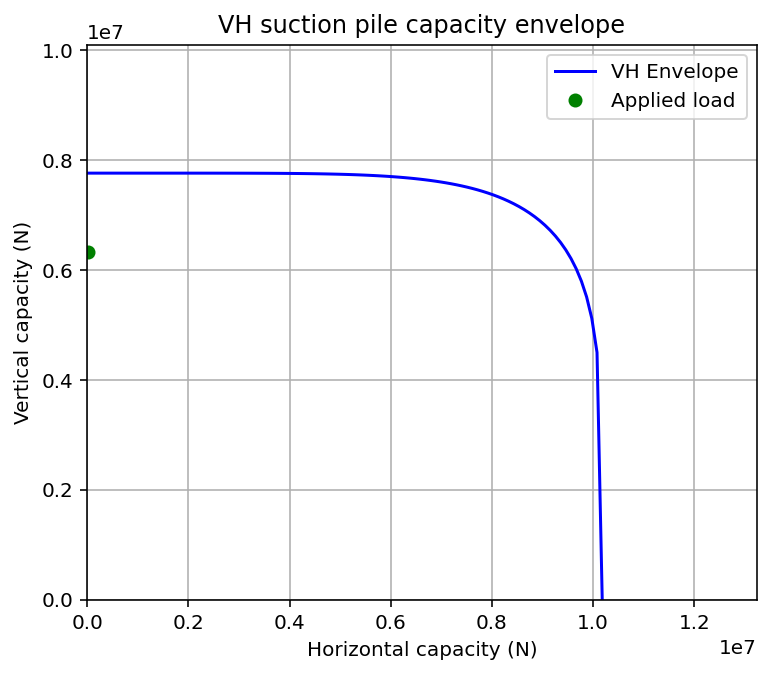
Figure 13 – VH capacity envelope.
Outputs Generated
- Concomitant load states
- Padeye loads
- Shared-anchor load evaluation
- Resultant anchor loads (Ha, Va, Ta) at padeye elevation
- Preliminary anchor sizing and assessment
- Capacity envelopes
- Utilization factors
Engineering Applications
The outputs support:
- Shared-anchor verification
- Preliminary anchor sizing under representative extreme loading conditions
- Geotechnical design decisions
- Preliminary anchor optimization workflows
This enables:
System Response → Anchor Demand → Geotechnical Verification
Relationship to Other Morie Study Cases
This study is the geotechnical verification layer of the Morie Analytics workflow.
Receives from
- morie_site → bathymetry context
- morie_layout → geometry and topology
- morie_soil → layered soil profile and load-transfer environment
- morie_mooring → design-driving loads
Completes
The anchor branch of the system workflow.
It provides the geotechnical transition from anchor demand to capacity-assessed design.
Why It Matters Commercially
Shared-anchor strategies only create value if they remain geotechnically feasible.
- Assesses the geotechnical feasibility of shared-anchor concepts
- Reduces unnecessary overdesign
- Links system loads to foundation cost
- Ensures geotechnical feasibility
This is where:
- Shared-anchor layout assumptions are geotechnically assessed
- Anchor cost is determined
- System design becomes geotechnically assessable
Aspects to Improve
- Soil–mooring static vs dynamic decoupling loads
- Probabilistic assessment of design loads
- Optimization anchor design loops
- Cyclic loading capacity
- Seismic analysis
Anchor capacity alone does not guarantee suction installation feasibility. Additional installation checks may be required for:
- Hydraulic gradient limitations
- Piping risk
- Cavitation
- Soil plug behavior
- Achievable penetration depth
These aspects remain outside the present capacity-screening workflow.
Design Philosophy
This study reflects the Morie Analytics approach:
- Physics-informed
- Modular
- Traceable
- Engineering-focused
- Scalable